
Knowledge capabilities in Zero (beta)
Zero AI Copilot has been enhanced with knowledge capabilities, allowing the system to better understand context and provide more relevant, informed responses by combining internal knowledge with retrieved information.
Advanced energy data in Zero (beta)
Zero AI Copilot can now work with power analyzer assets and retrieve data from energy meters, making it easier for users to monitor and analyze energy-related information directly from the platform.
Tool feedback in Zero (beta)
The Zero AI Copilot interface now provides clearer feedback when tools are used. This makes interactions more transparent and helps users better follow what the AI is doing behind the scenes.
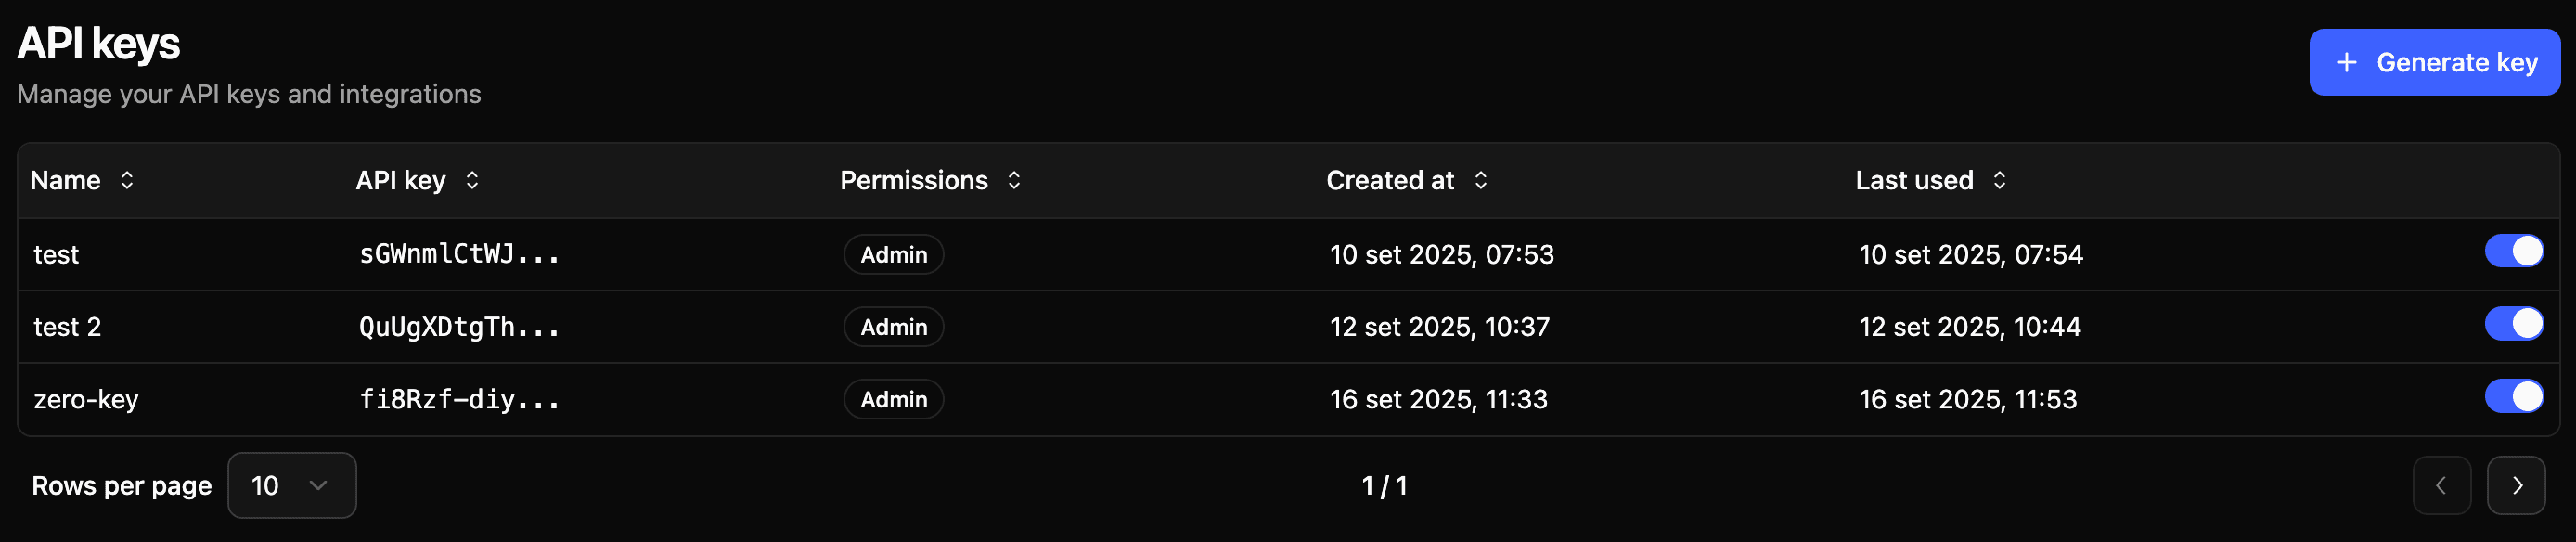
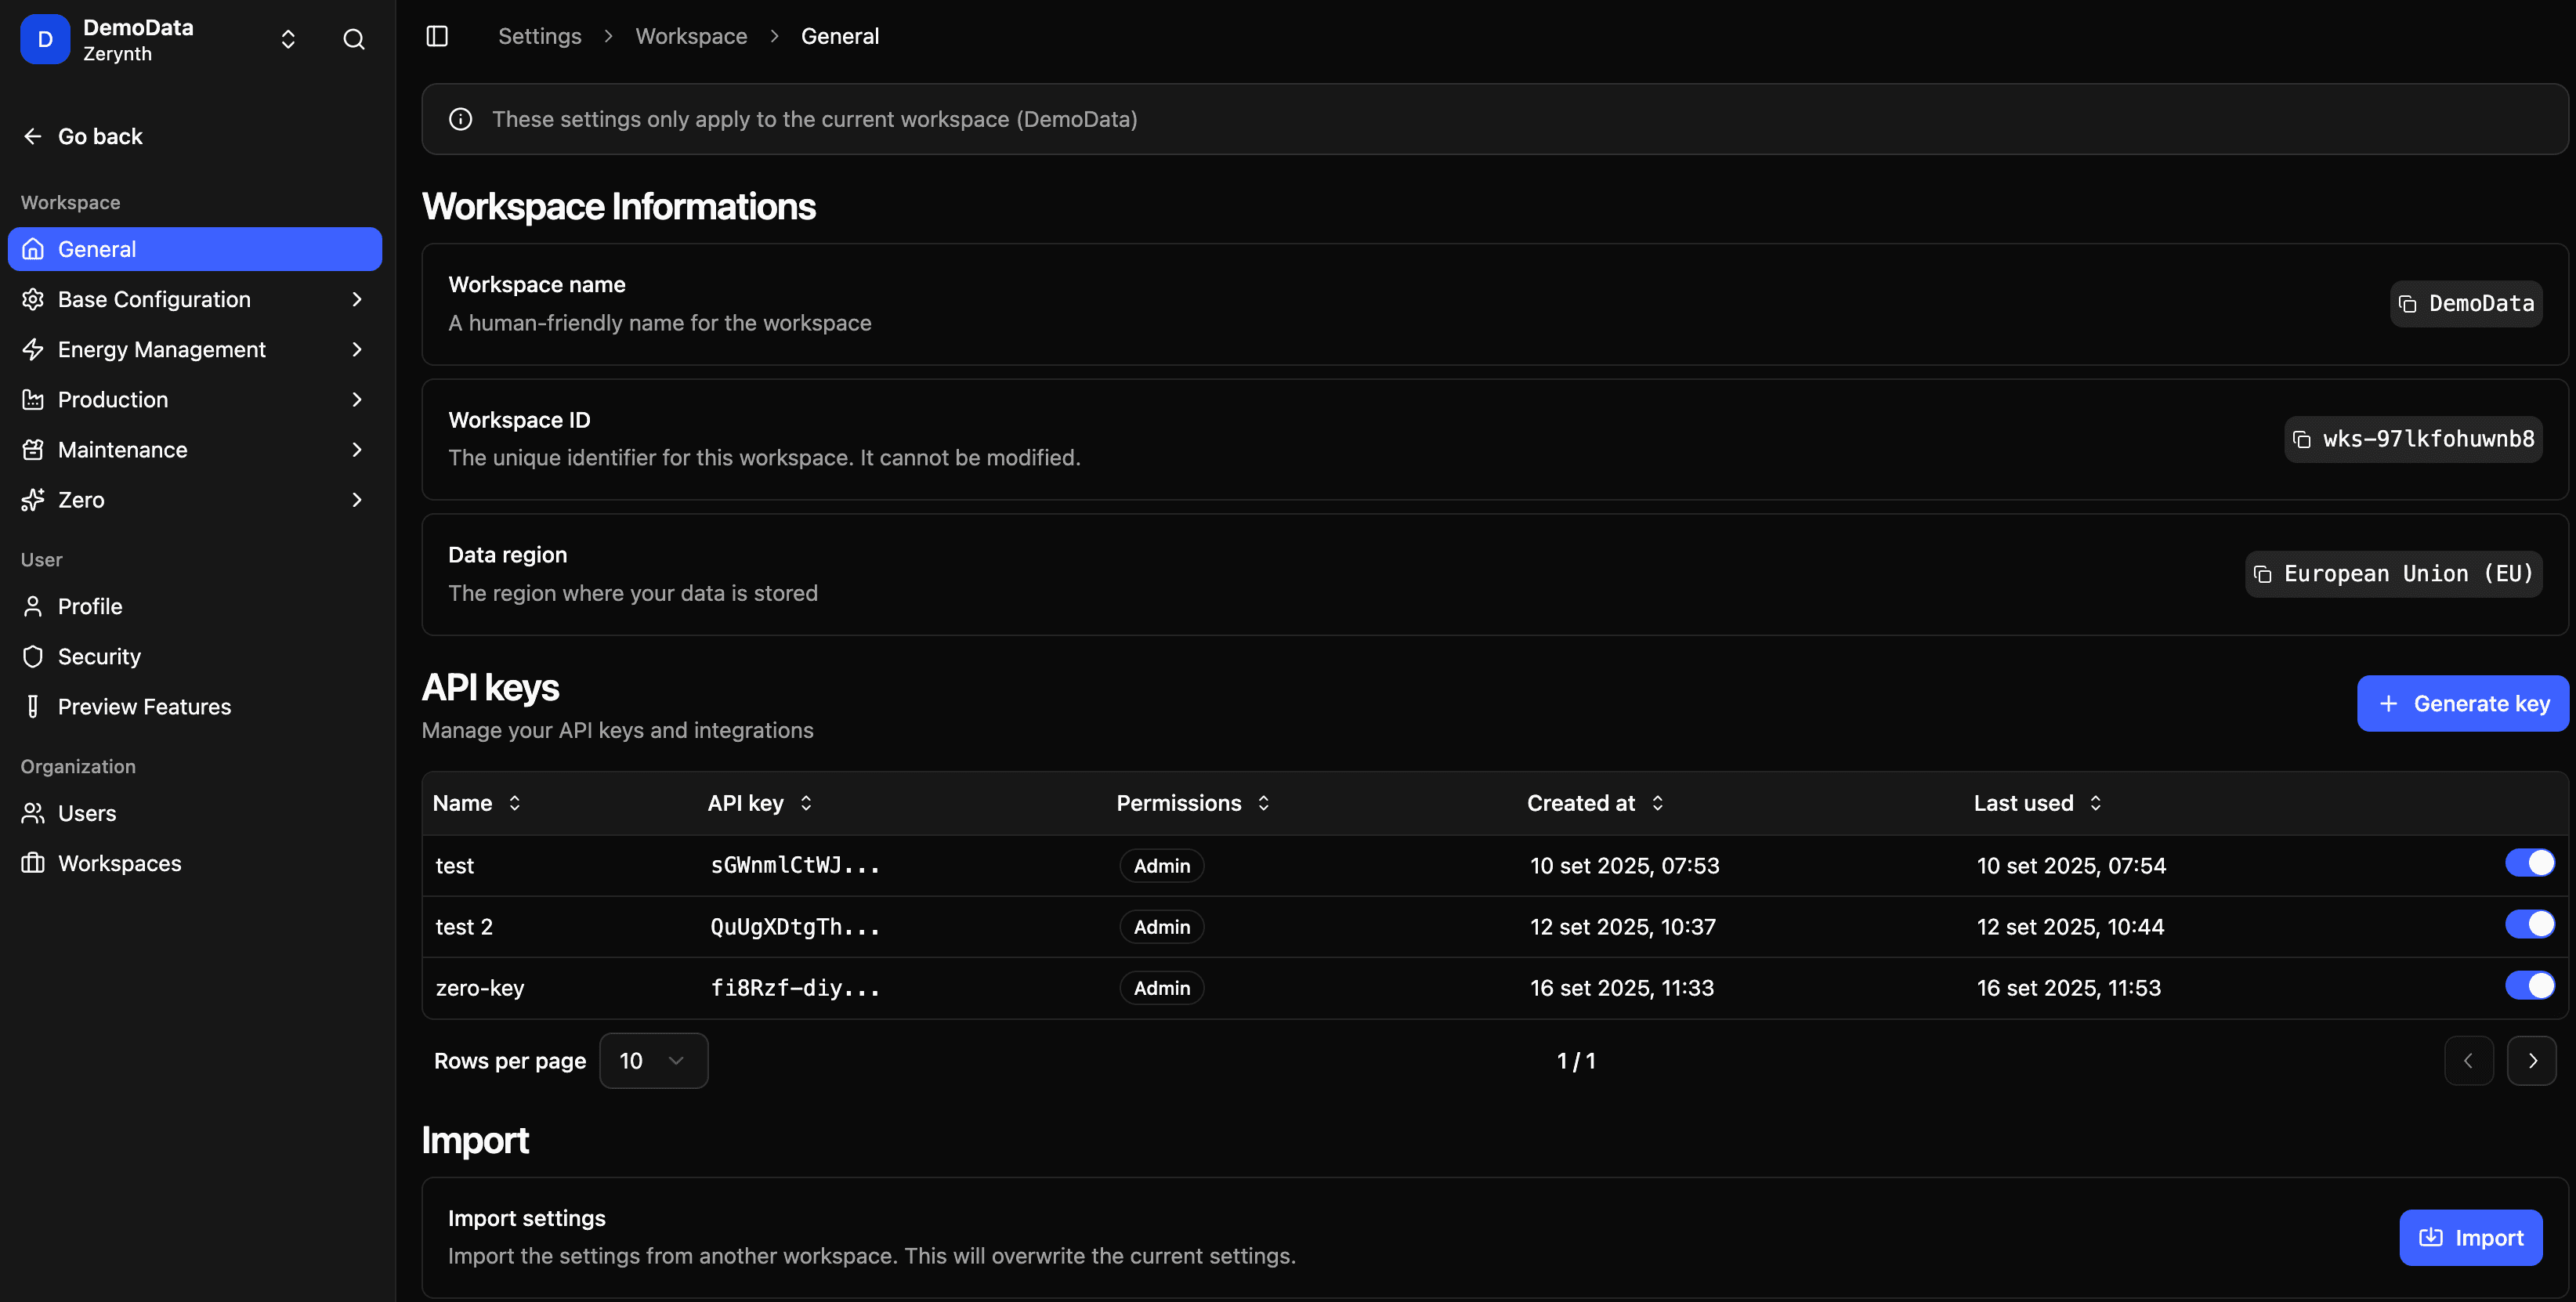
API Key usage visibility
API Keys now show when they were last used. This helps users better understand how their keys are being used and supports improved visibility and control.
Redesigned Settings
The Settings section has been redesigned to offer a cleaner layout and a more intuitive navigation experience, making it easier for users to find and manage configuration options.
New login and Terms of Service
A new login experience has been introduced for all customers. After login, users are now asked to review and accept the Terms of Service. As part of this change, the related reference documentation has been updated and aligned with the new process.
Faster Raw Data API
The Raw Data API has been optimized to improve performance. As a result, response times are significantly faster, with an average improvement of around 40%.
Cycle Time Optimizer improvements
The Cycle Time Optimizer is now simpler and more user-friendly. It also shows the percentage difference between the current value and the suggested one, helping users quickly understand the potential impact of changes.
Zerynth Academy in Help
A direct link to the Zerynth Academy has been added to the Help section, guiding users to video tutorials and learning resources to better explore and use the platform.