Track KPIs and Create Interactive Dashboards in Zerynth Cloud
Dashboard is the interface the user uses to interact with the IoT solution. It enables clear visualization of key KPIs on the solution and enables control over fleets of devices. Zerynth makes it easy to control devices, monitor industrial sensors and machines, and generate reports through our integrated dashboard service. In this tutorial, We will create our first dashboard in Zerynth Cloud, We will create a basic template with 1 panel to visualize data, Feel free to customize the template according to your application.
Activate Zerynth Dashboard
The first step is to enable the Zerynth Dashboard service in your workspace, Inside your workspace, click on “Zerynth Dashboard” section in the left bar.
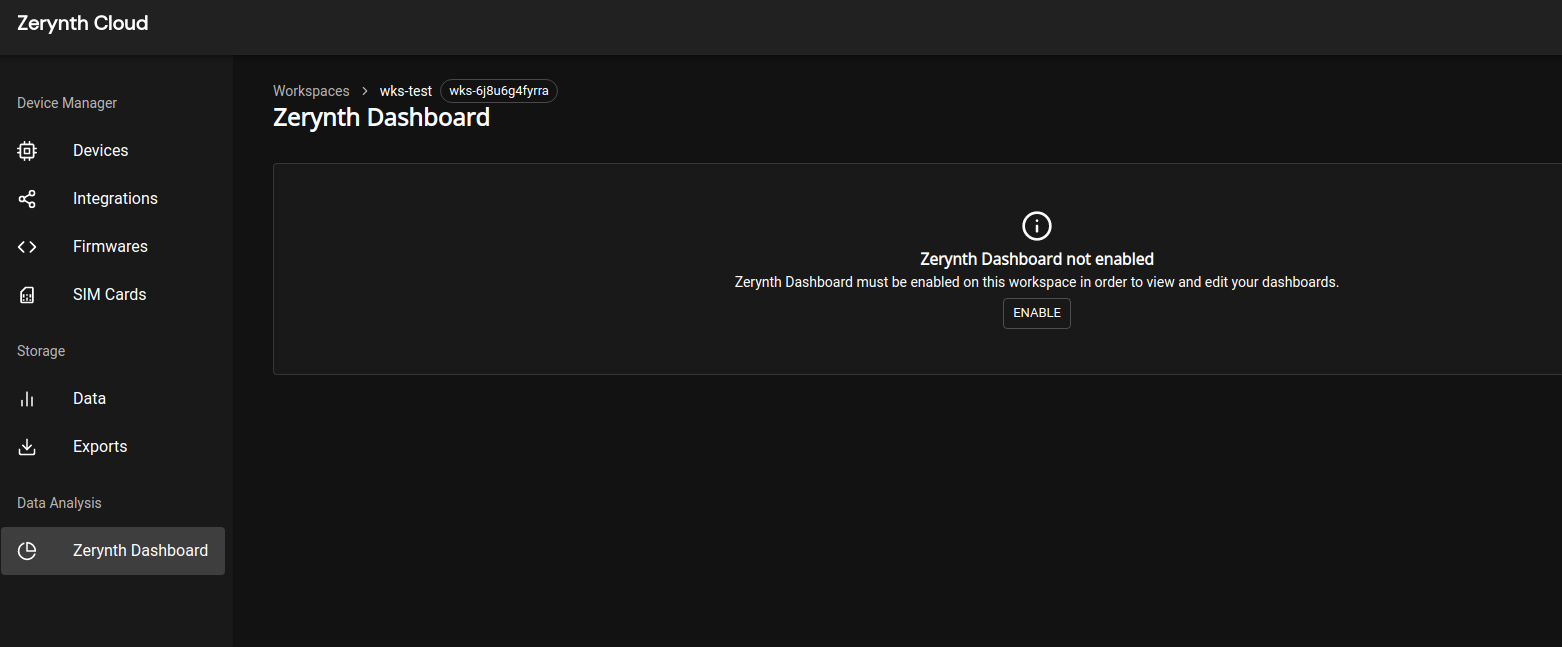
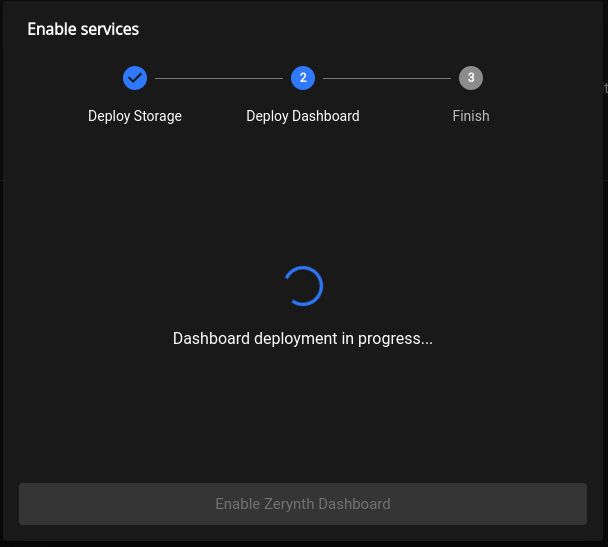
Enable the dashboard service by clicking “Enable Zerynth Dashboard” button.
Create a new Layout
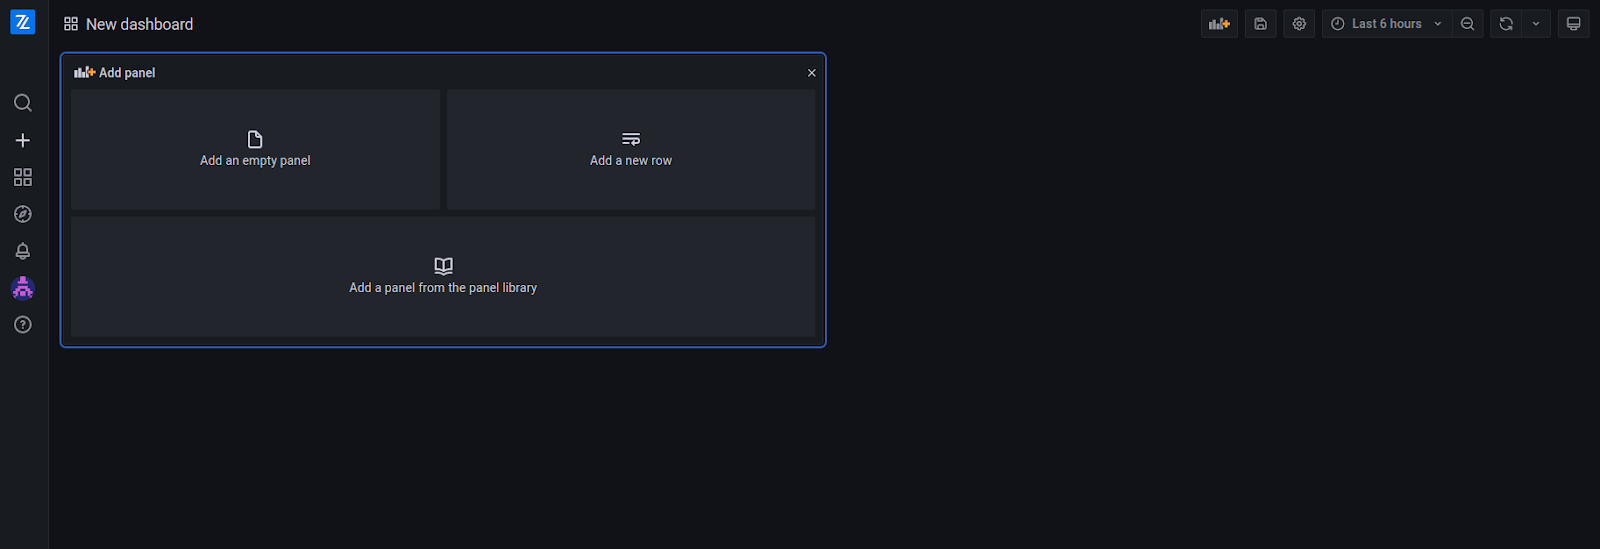
Inside the dashboard section, Click on “+” and then on “Dashboard”.
Create a new panel by clicking on “Add an empty panel".
On the right, there are some settings about the panel such as panel name, panel type, and other settings that depend on the active panel. On the left side, you can make a query to get data to visualize. You can write a query using “Query builder” or write an SQL raw query. Initially, you are in “Query builder” mode, but by clicking on “Edit SQL” you switch to raw query mode.
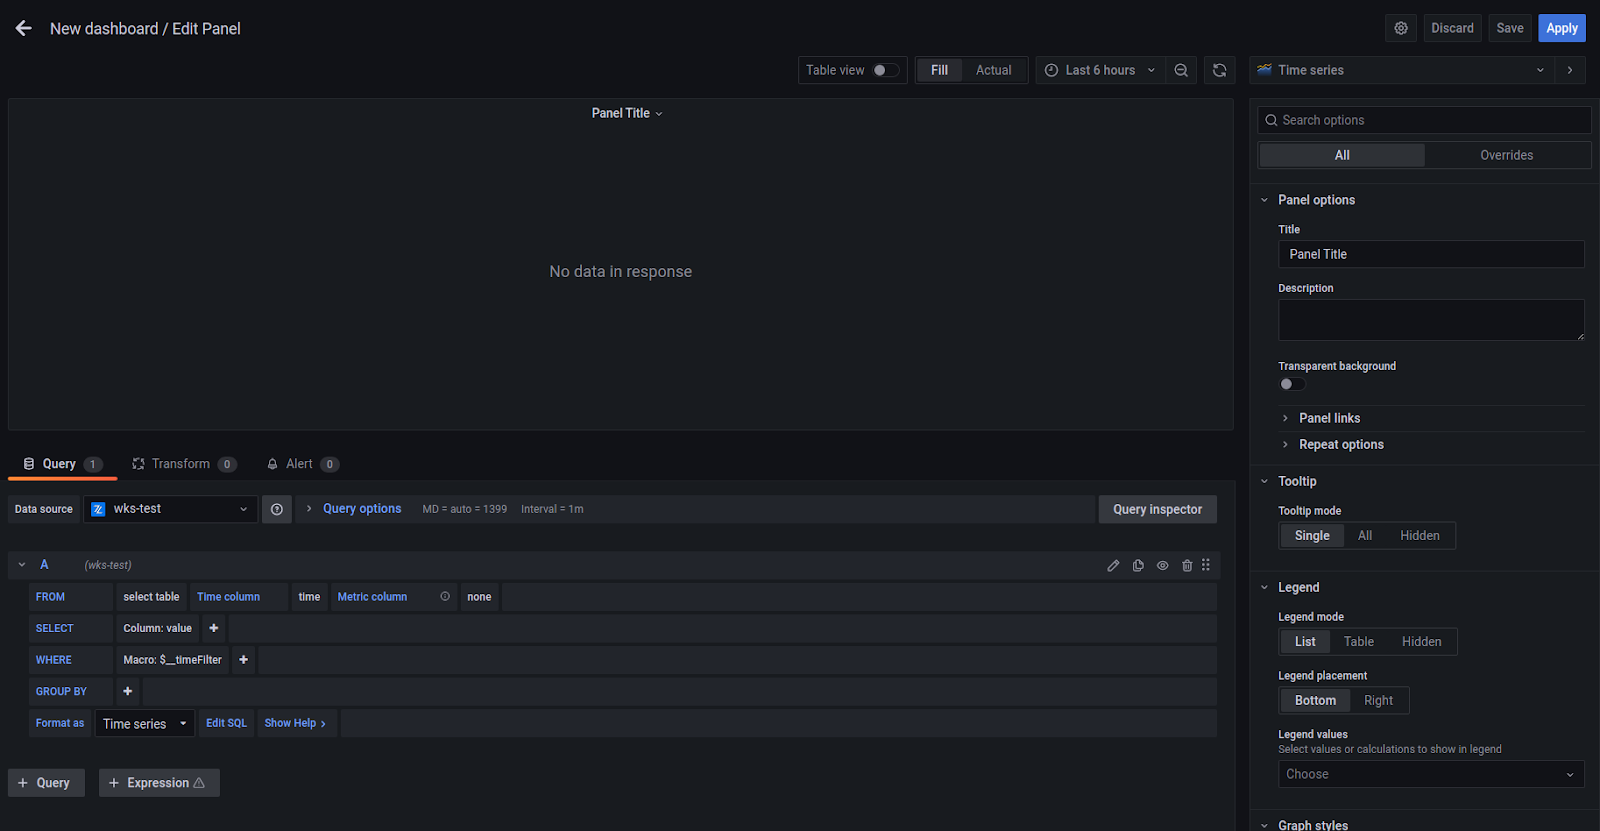
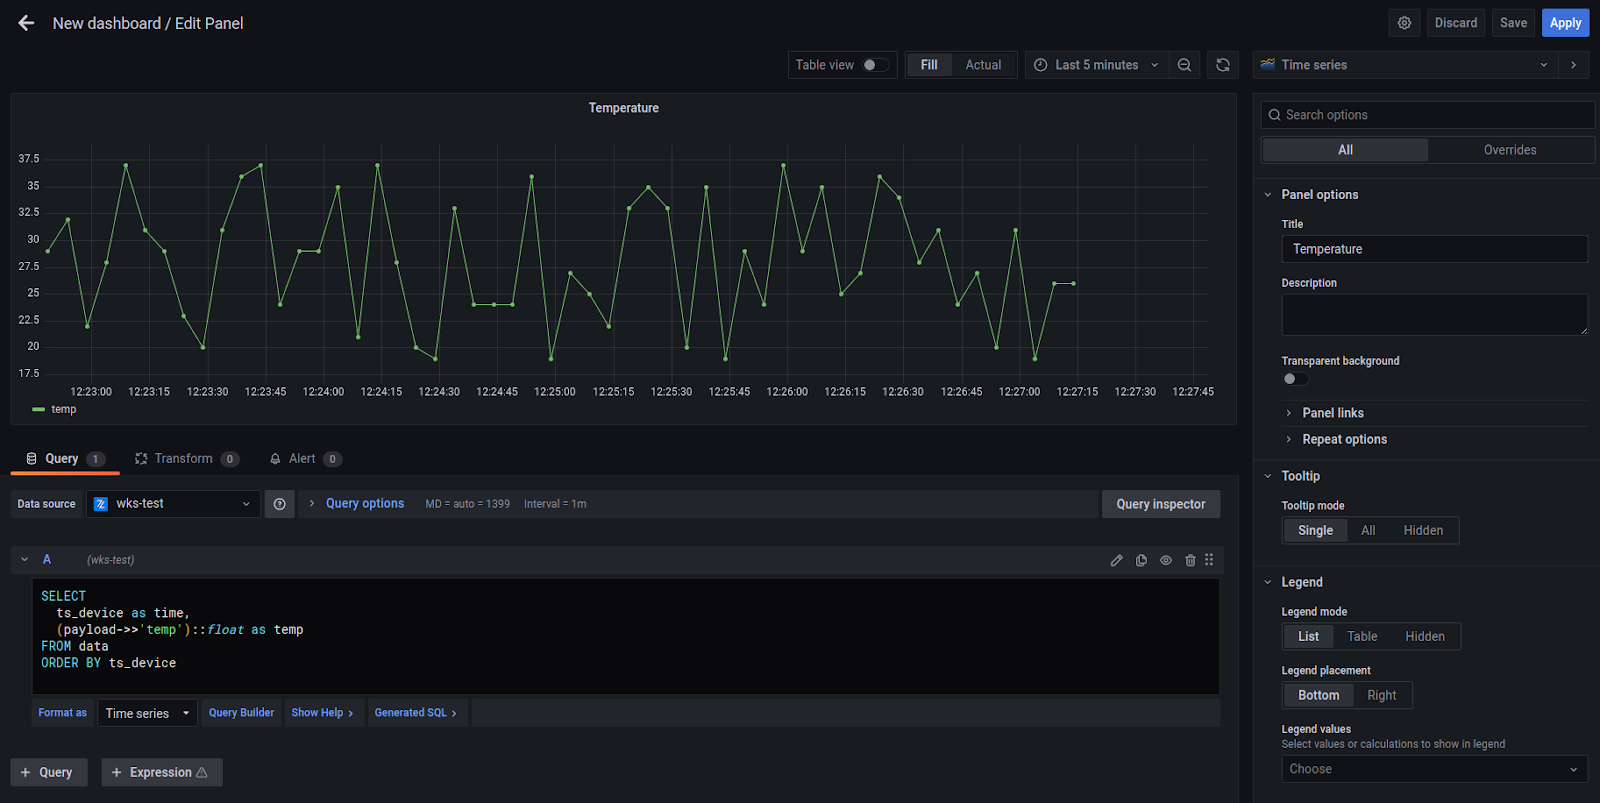
Here's an example of an SQL raw query with the “Time series” panel type.
SELECT
  ts_device as time,
  (payload->>'temp')::float as temp
FROM data
ORDER BY ts_device
Click on the “Save” button on the top right to save the dashboard.
SQL Query
through SQL queries you can get data or conditions.
Data queries
To get data, you need to put “data” after “FROM”, and you can use the following columns.
| Name | Type | Description |
|---|---|---|
| ts_device | time | Timestamp corresponding to when the data has been sent by device |
| ts_zdm | time | Timestamp corresponding to when the data has arrived on ZDM |
| ts_db | time | Timestamp corresponding to when the data has been save on database |
| workspace_id | string | Workspace id of the device |
| fleet_id | string | Fleet id of the device |
| device_id | string | Id of the device |
| tag | string | Publication tag with whom the data has been sent by device |
| payload | jsonb | Payload published by device |
Events queries
To get events, you need to put “events” after “FROM”, and you can use the following columns.
| Name | Type | Description |
|---|---|---|
| ts | timestamp | The UTC timestamp of the event |
| ts_db | timestamp | Timestamp corresponding to when the data has been save on database |
| workspace_id | string | Workspace id of the device |
| fleet_id | string | Fleet id of the device |
| device_id | string | Id of the device |
| type | string | Type of the event (e.g., connecttion, job) |
| direction | string | The direction of the event. Possible values are: c2d (Cloud to Device) or d2c (Device to cloud) |
| payload | jsonb | Payload of the event |
More information
In simple steps, we have created our template in Zerynth dashboard. If you have any questions, Please drop us a message on our Helpdesk.