Zerynth Toolbox for commissioning
Introduction
This toolbox aims to simplify both on site activities and testing of Zerynth Apps using the Zerynth agents. It is avaible at this link. It features a Machine Scanner to acquire data from various PLCs, a PLC Simulator to replay the acquired data or to generate new data via an OPC-UA server and a Connectivity Checker to be able to test whether the Zerynth cloud endpoints are reachable. The windows executable is ready to be executed, while on Linux you can both double click on it or open a terminal and execute the following commands:
cd ~/Downloads
chmod +x zerynth-toolbox
./zerynth-toolbox
Machine Scanner
Analog and digital reading
If you have a 4ZeroBox Lite or Essential IoT Kit with EXP-IO connected, it can be used to read up to two amperometric clamps (0-5V) and to read up to two digital inputs.
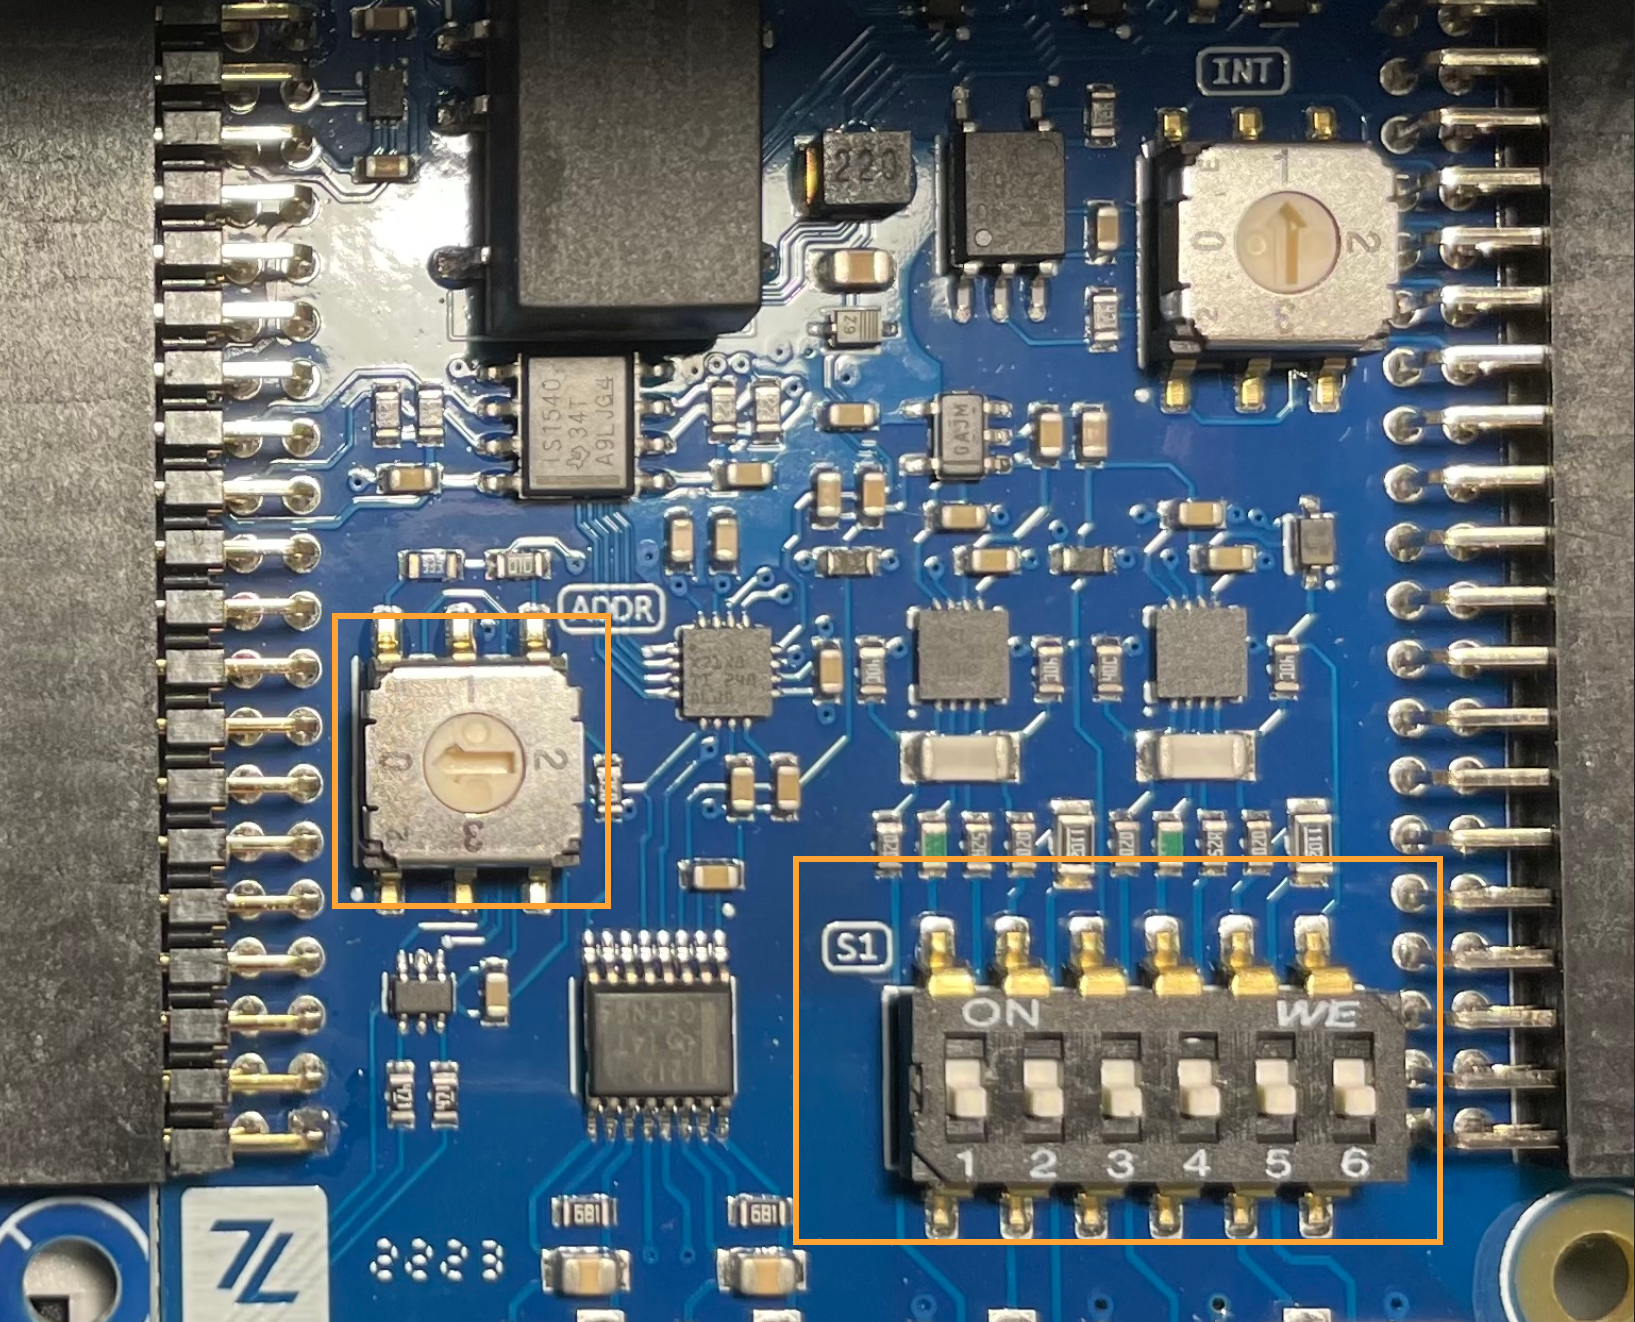
Please, before connecting the device check the EXP-IO board and take note of the ADDR switch position and move that all the switches on the S1 DIP switches to the off position.
Install drivers (Windows only)
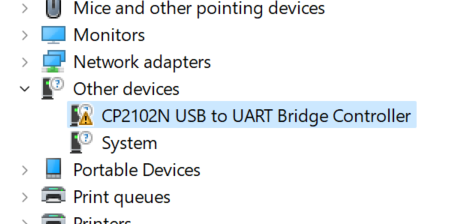
If you're on Windows and you haven't installed the drivers for the CP210x USB to UART Bridge yet, please install them before continuing. First, download the drivers and unzip the folder. Then press WIN + x, click on Device manager and look for Other devices
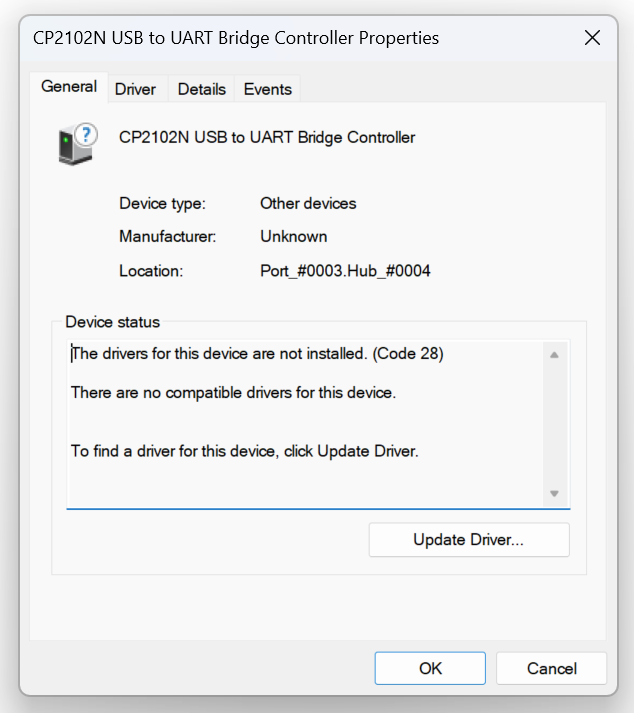
Double-click on the UART device and then click on Update driver
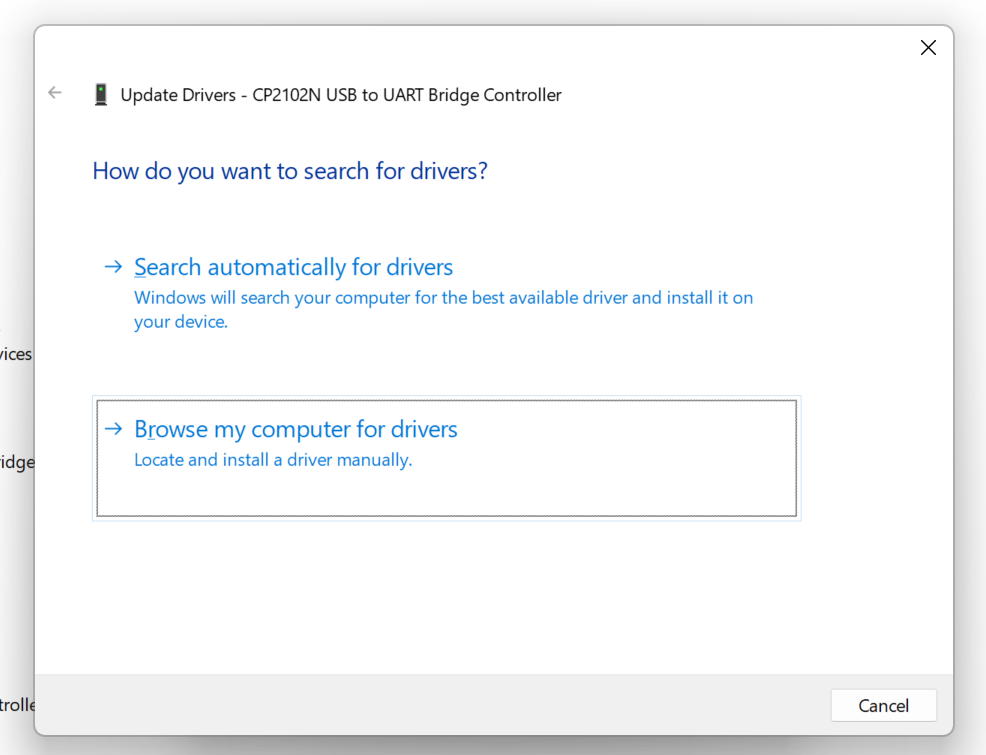
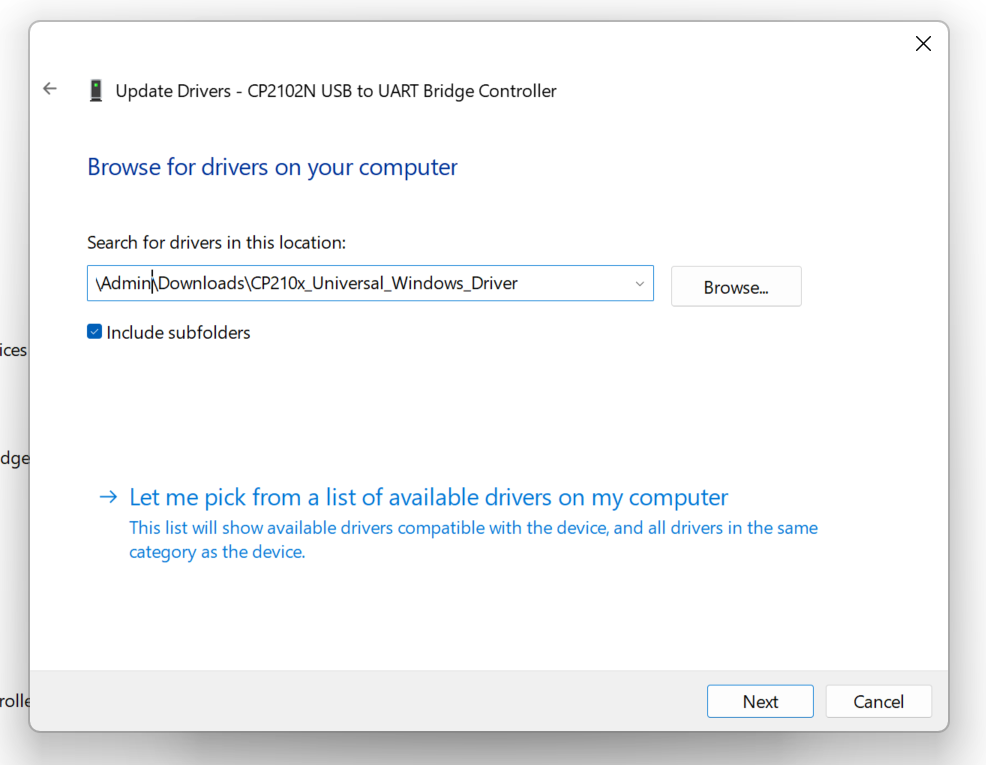
Click on Browse my computer for drivers
Finally, select the folder where you extracted the drivers and click on Next
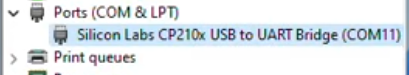
Now you should see the device listed under Ports (COM & LPT)
Read from the device
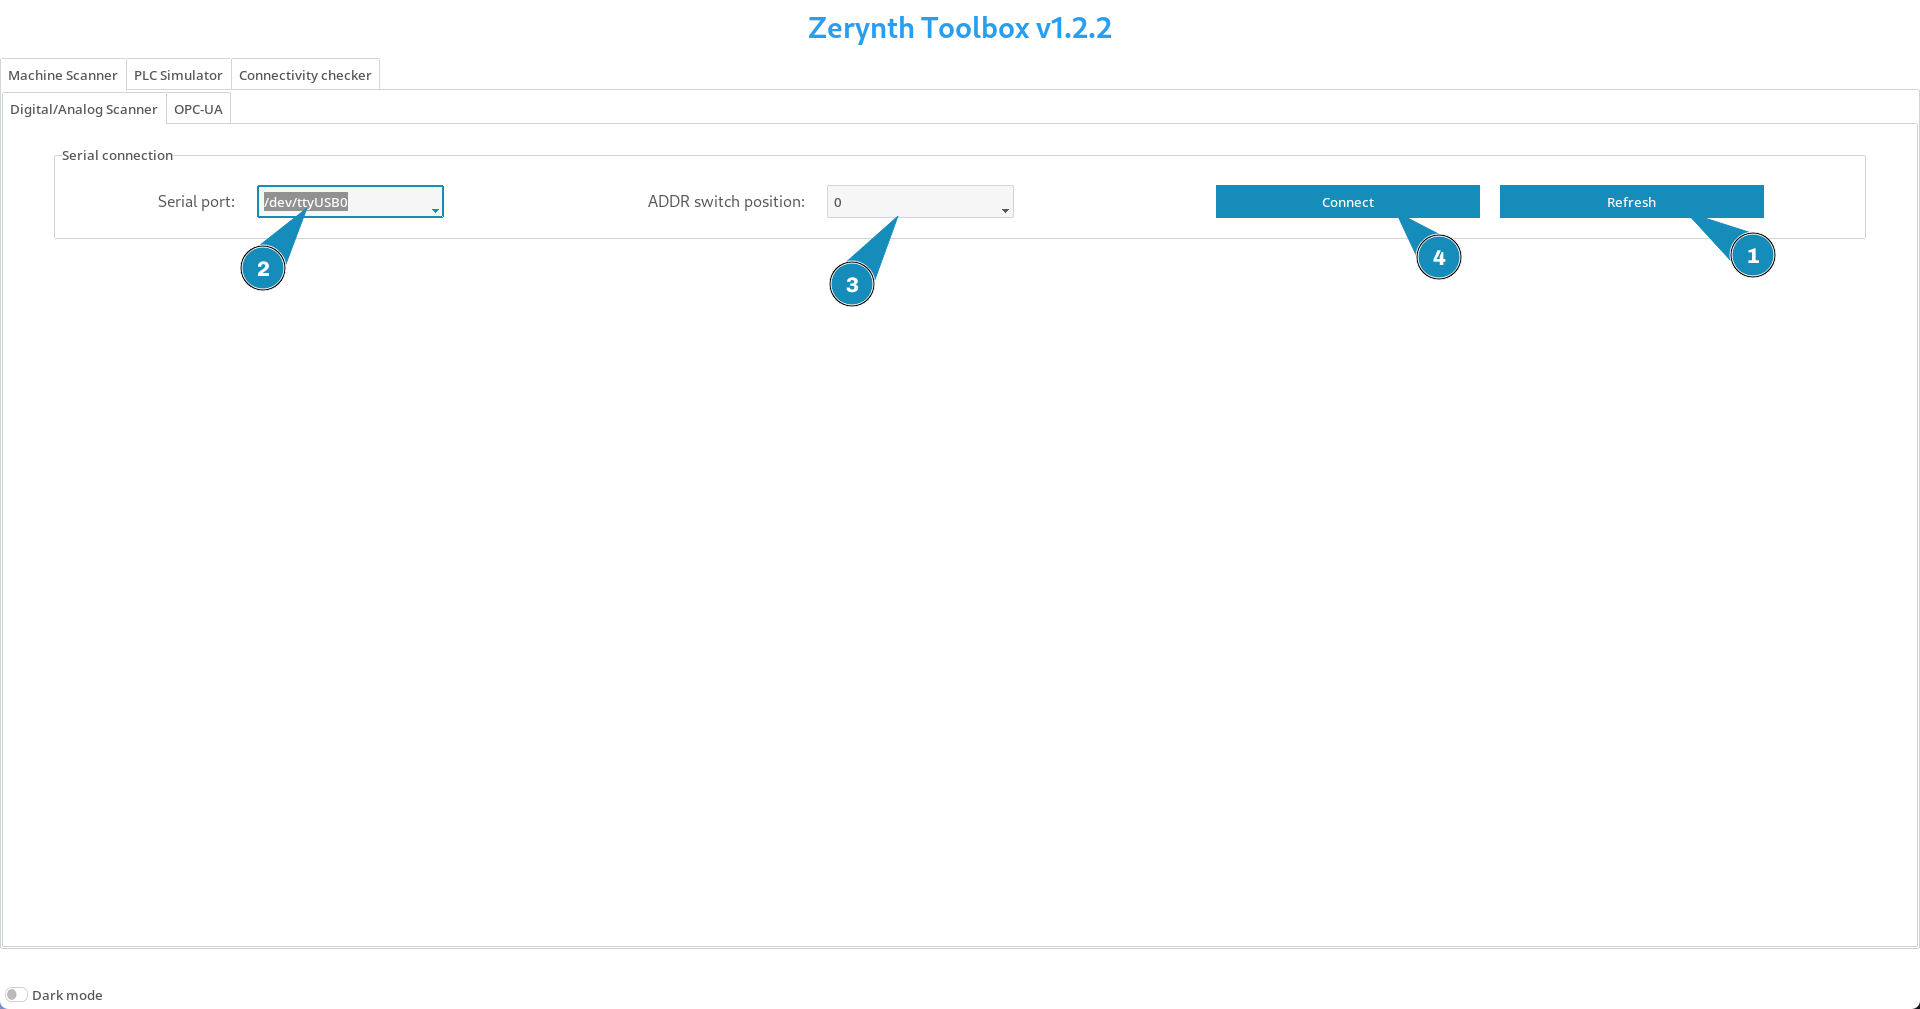
Once done, head to the Machine Scanner tab, and select the Digital/Analog Scanner tab to connect to the device.
Now, you can set the clamps' amperage, the power source phases, the network voltage and specify whether the logic of the digital inputs has to be inverted.
Then, you can start reading from the device by clicking on the Start reading button.
If the LED of the device is flashing red, it means that it cannot connect to the EXP-IO board. In this case make sure that the switches are in the correct position.
OPC-UA
To scan an OPC-UA server open the Machine Scanner tab and then click on OPCUA
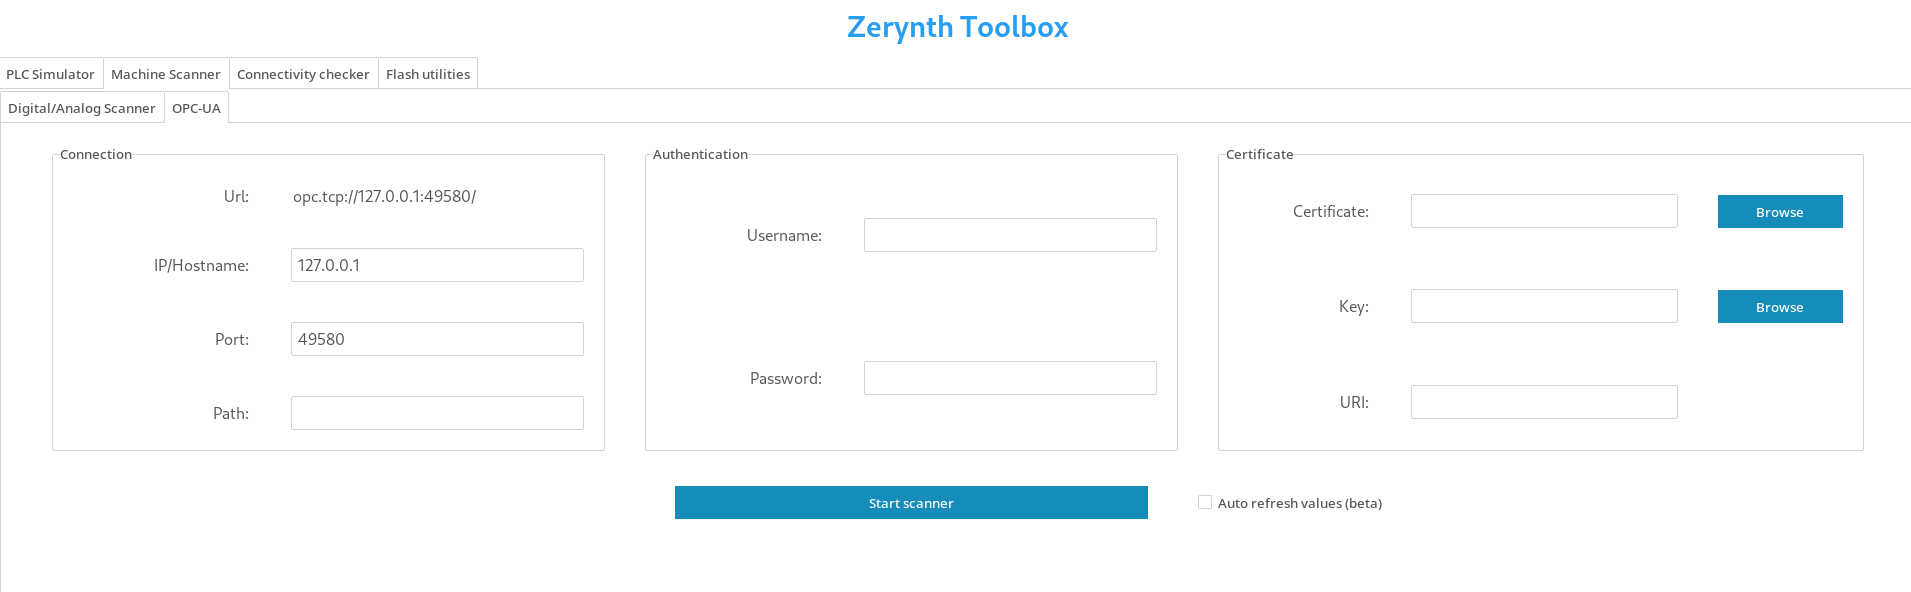
Insert the following parameters:
- IP/Hostname, Port and Path: usually, an OPC-UA server is identified by an url like
opc.tcp://[ip or hostname]:port/path. Leave the path empty if it's not needed. - Username and password: provide these parameters if the server requires user authentication, otherwise leave them empty.
- Certificate, key and Application URI: provide these parameters if they are required by the server, otherwise leave them empty. The application URI can be found inspecting the certificate with the terminal command
openssl x509 -in certificate.crt -text -nooutand usually is something likeurn:host:field1:field2.
Now, you can start the scanner and wait for the scanning process to complete.
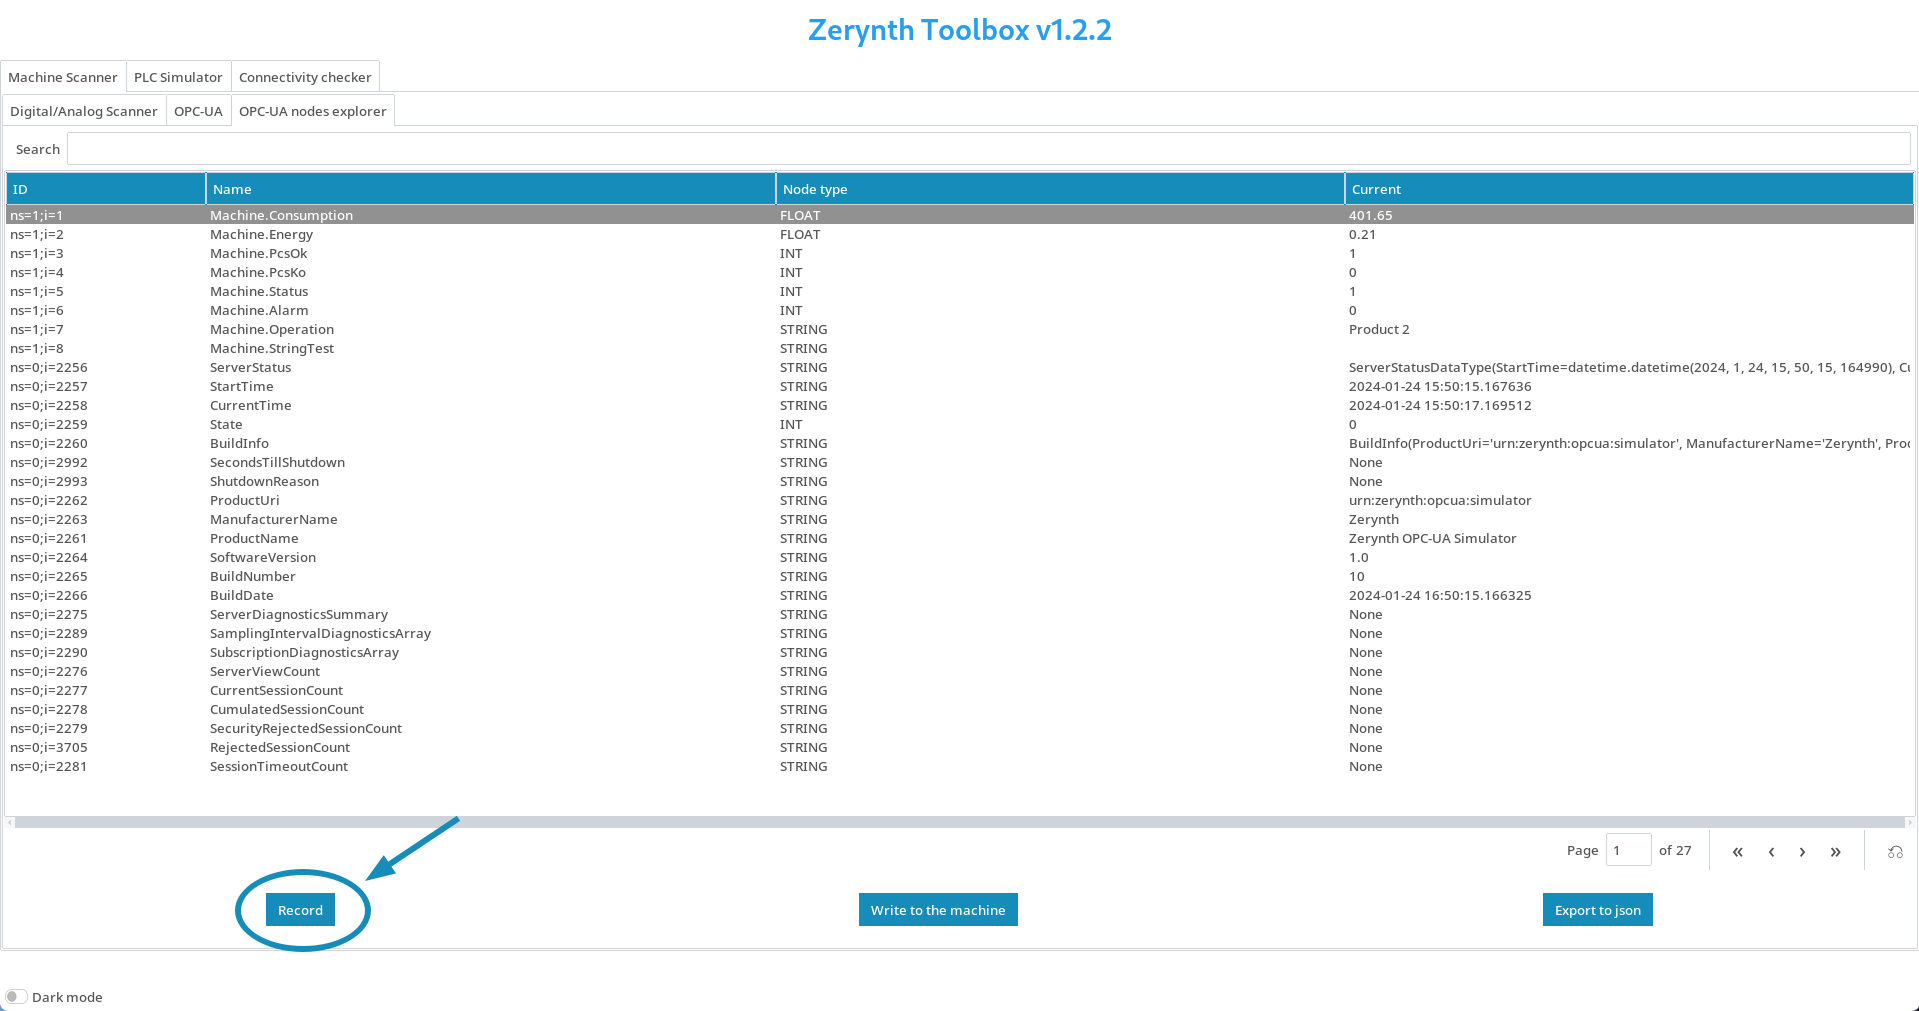
Once the scanner has finished its job, a new tab containing the scanned nodes will appear: there you can open the record and the export dialogs.
Recording a session
To record a session, click on the Record button
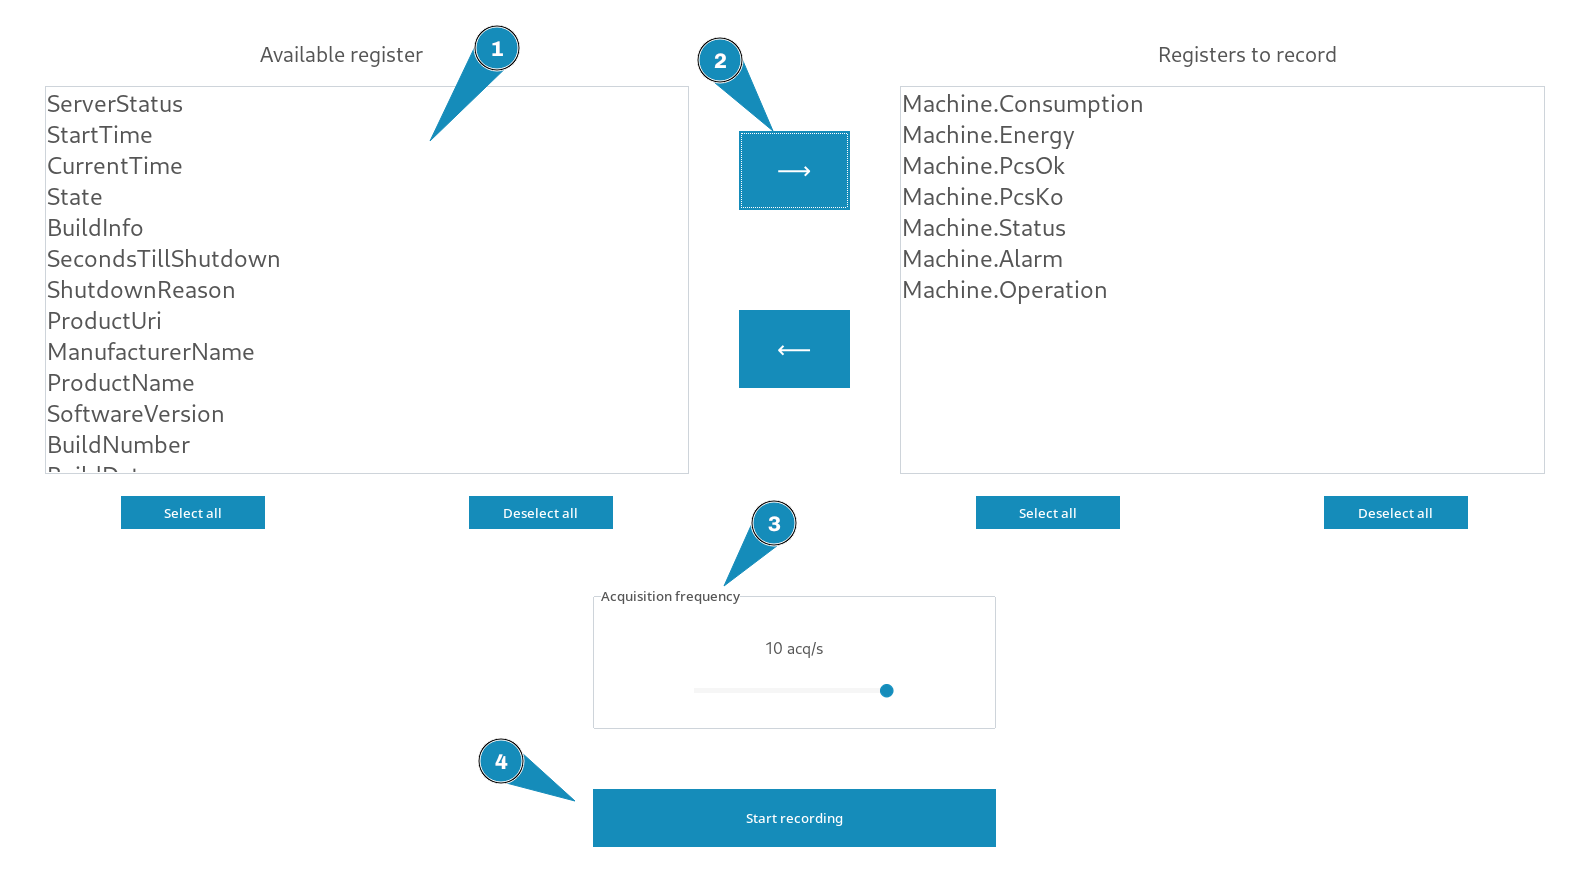
Select the nodes to record, select the acquisition frequency and start recording
To stop recording, click on the Record button again and click on the stop button.
The session will be saved on a csv file containing a column with the timestamp in millisecond and the columns containing the nodes values:
| timestamp (ms) | ns=1;i=1 | ns=1;i=3 | ... | ns=1;i=7 |
|---|---|---|---|---|
| 1701095566041 | 1168.01 | 50 | ... | HIGH |
| 1701095566143 | 1201.99 | 50 | ... | HIGH |
| ... | ... | ... | ... | ... |
| 1701095594530 | 600.11 | 106 | ... | LOW |
| 1701095594632 | 700.13 | 106 | ... | LOW |
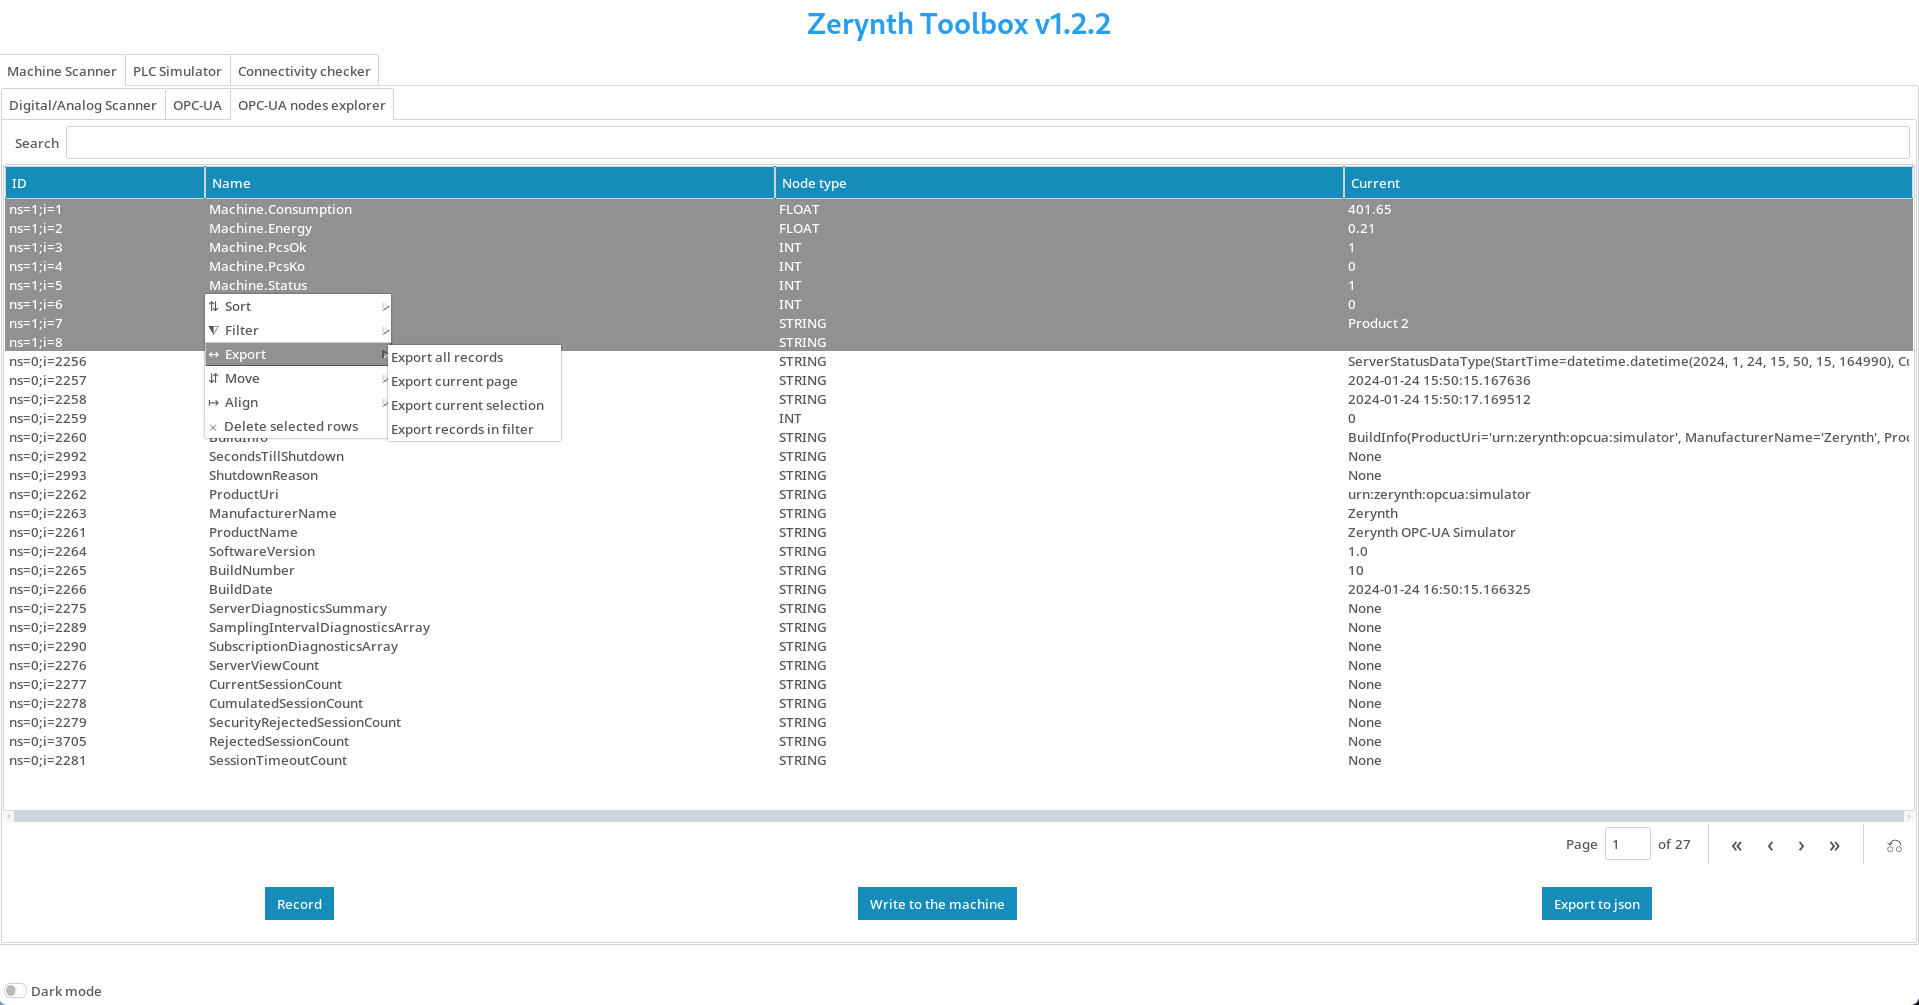
Exporting a table
To export a table in CSV format you can right click the table and open the export menu. You can also select multiple rows with SHIFT + click.
The CSV format is useful for further reference of the server nodes, here's an example:
| nodeid | name | type |
|---|---|---|
| ns=1;i=1 | Machine.Consumption | FLOAT |
| ns=1;i=2 | Machine.Energy | FLOAT |
| ns=1;i=3 | Machine.PcsOk | INT |
| ns=1;i=4 | Machine.PcsKo | INT |
| ns=1;i=5 | Machine.Status | INT |
| ns=1;i=6 | Machine.Alarm | INT |
| ns=1;i=7 | Machine.Operation | STRING |
To export in JSON format click on the Export to JSON button
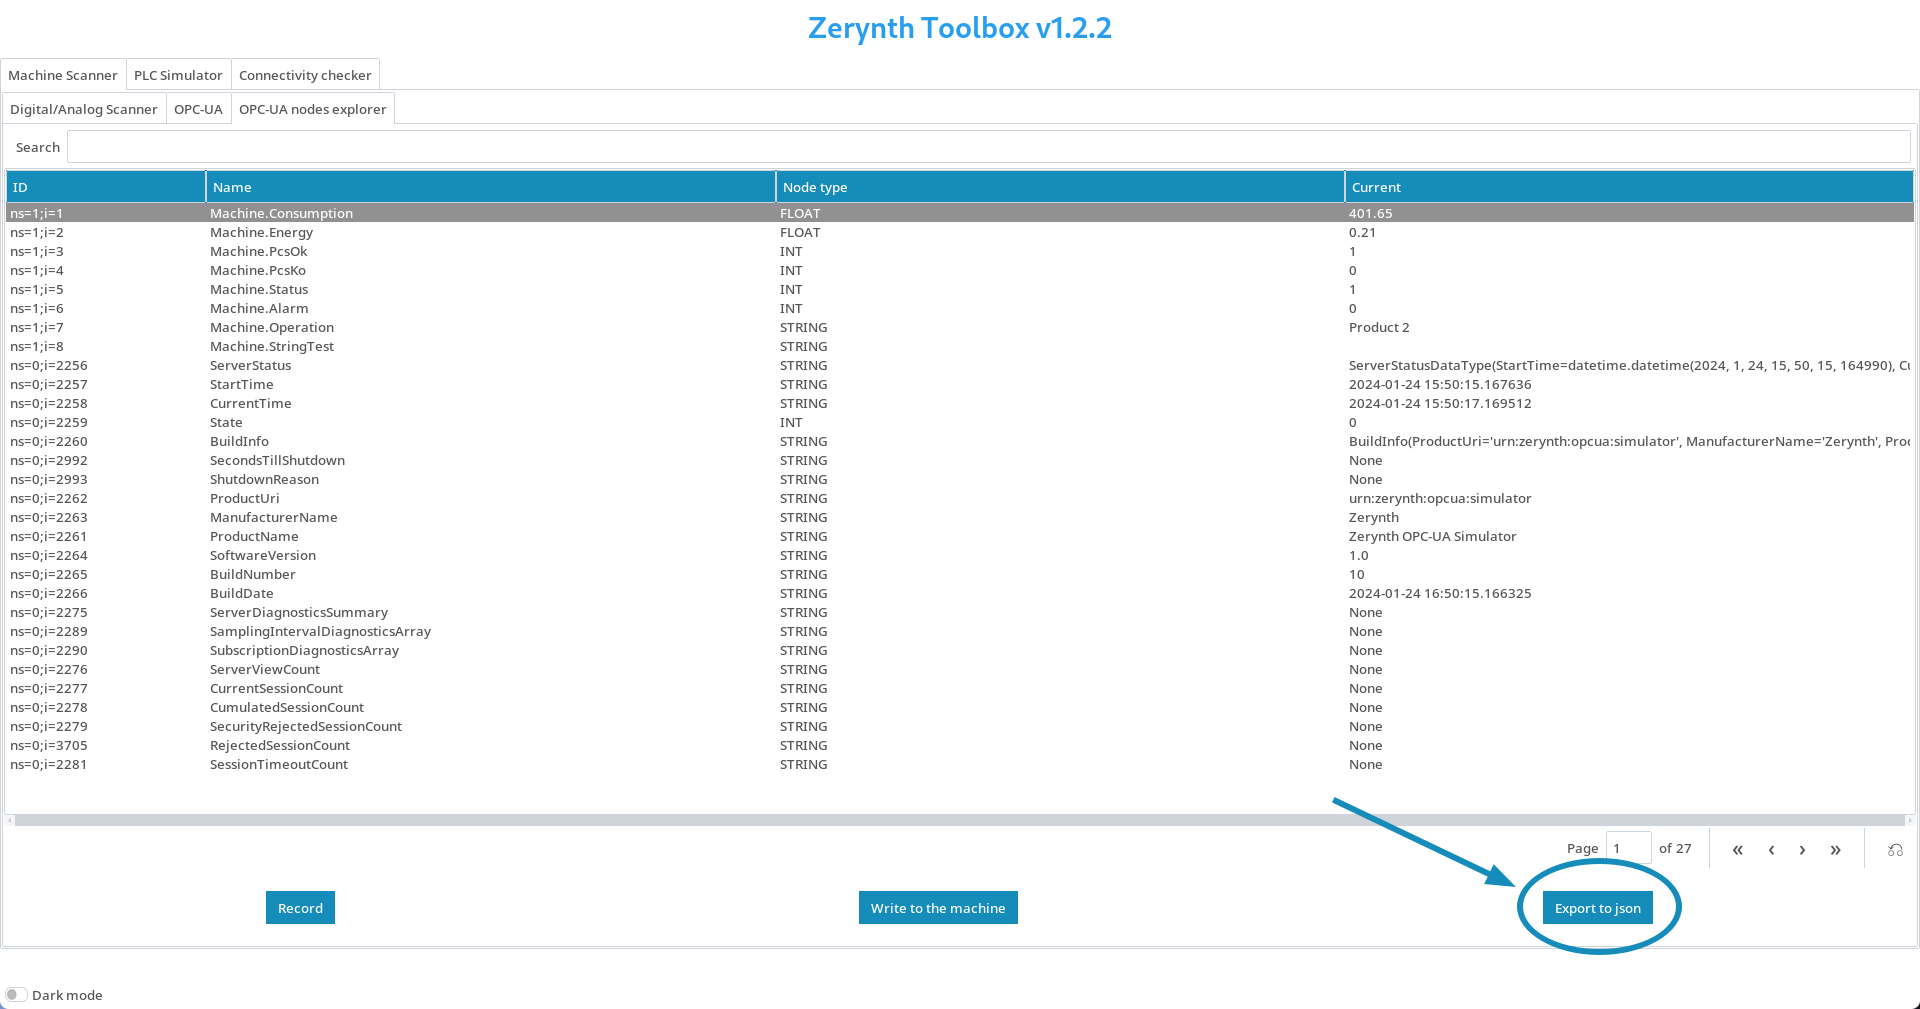
Then select the nodes you want to export and click on Export to JSON
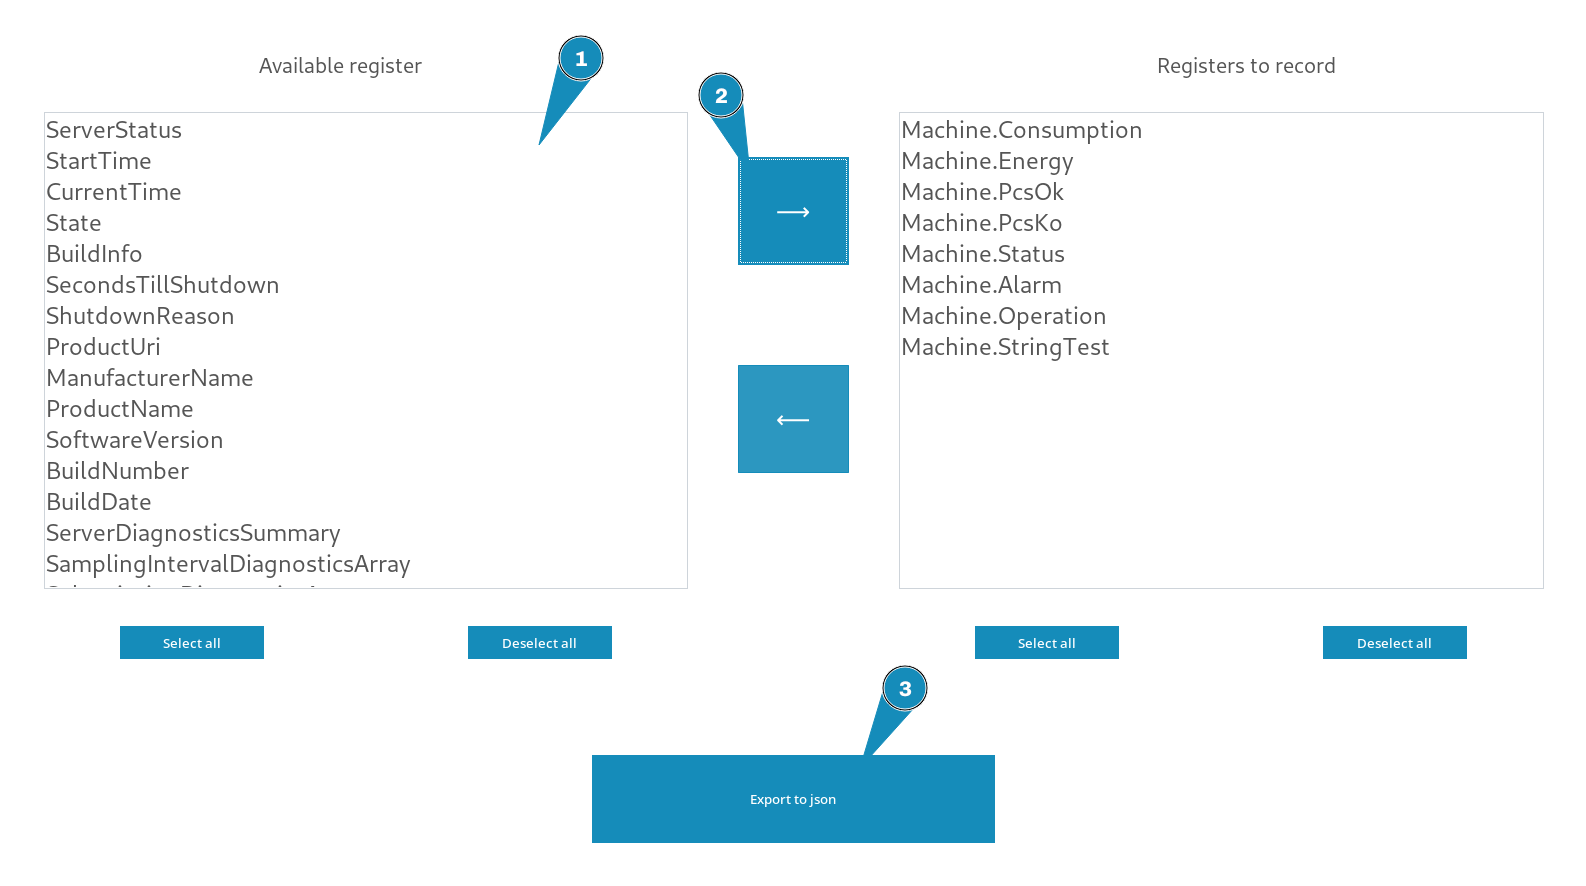
The JSON format, instead, is compatible with the 4ZeroAgent and can be used in the graph configurator (check here) to configure the OpcuaNode graph node.
Here's an example:
{
    "nodes": [
        ["ns=1;i=1","FLOAT"],
        ["ns=1;i=2","FLOAT"],
        ["ns=1;i=3","INT"],
        ["ns=1;i=4","INT"],
        ["ns=1;i=5","INT"],
        ["ns=1;i=6","INT"],
        ["ns=1;i=7","STRING"]
    ]
}
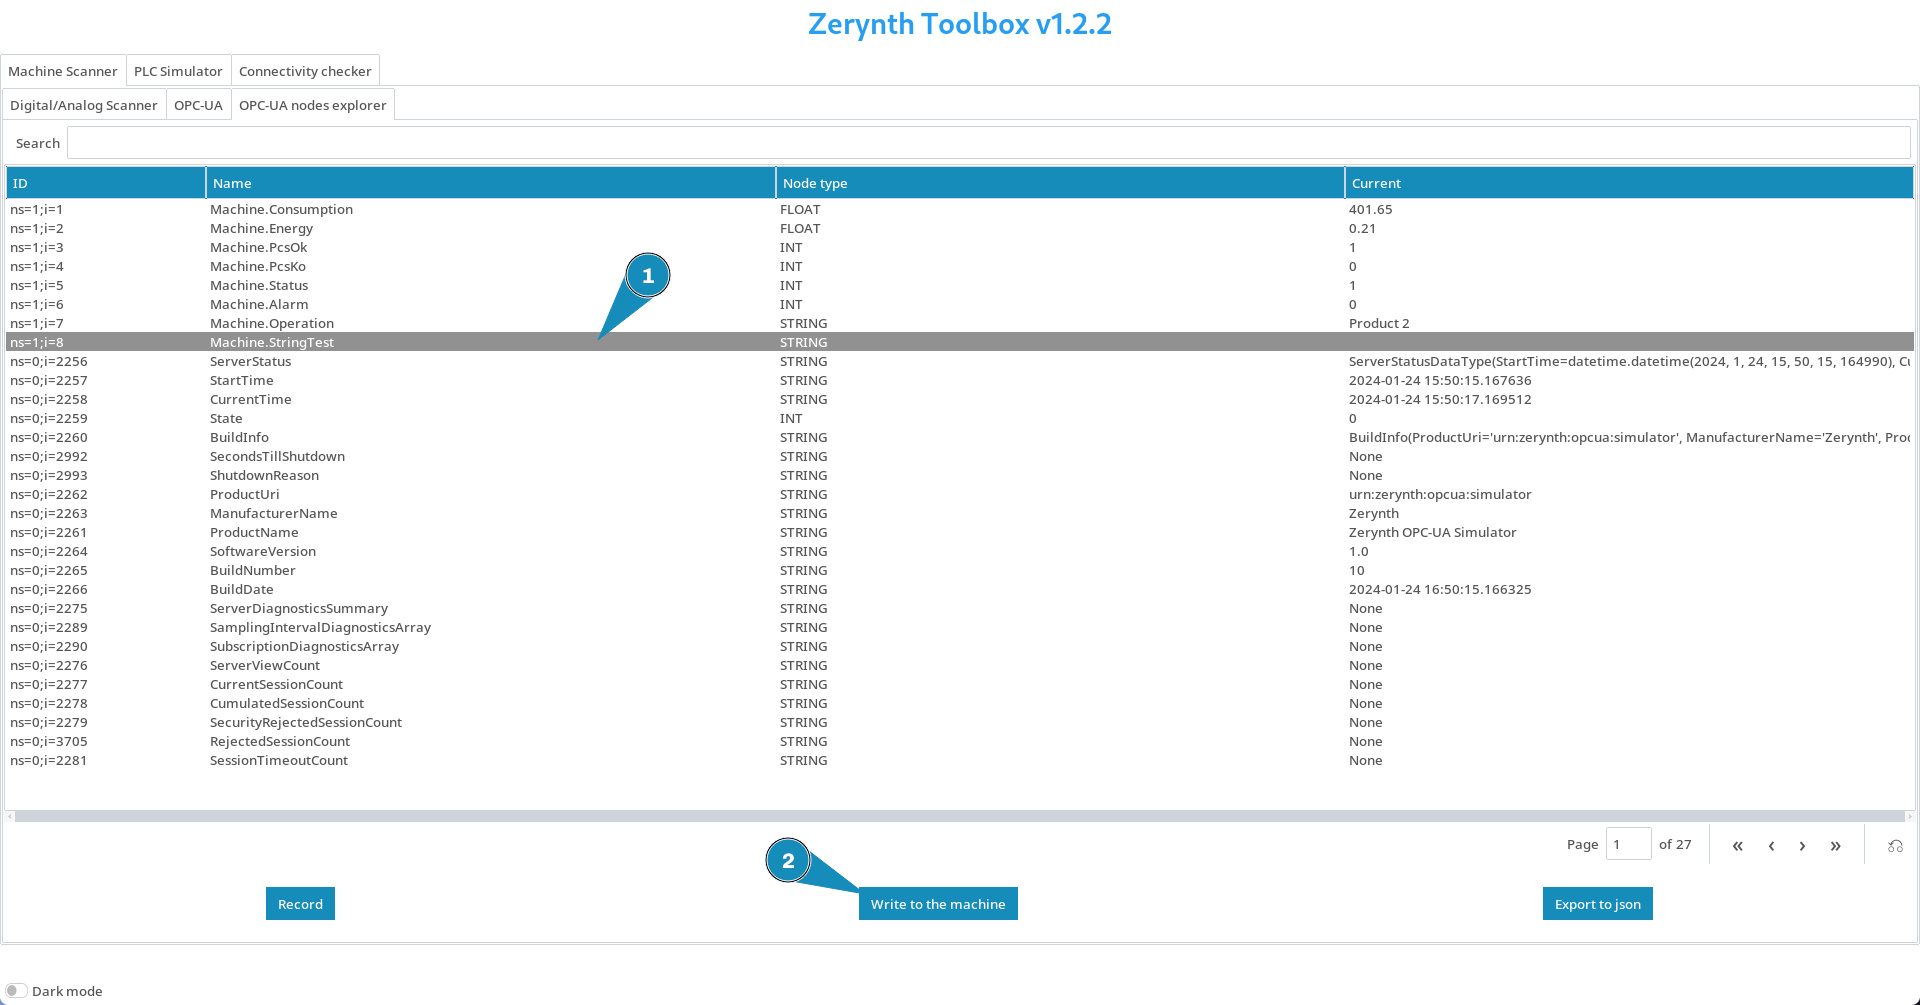
Write to a variable
In order to write to a variable, first select it and then click on Write to the machine
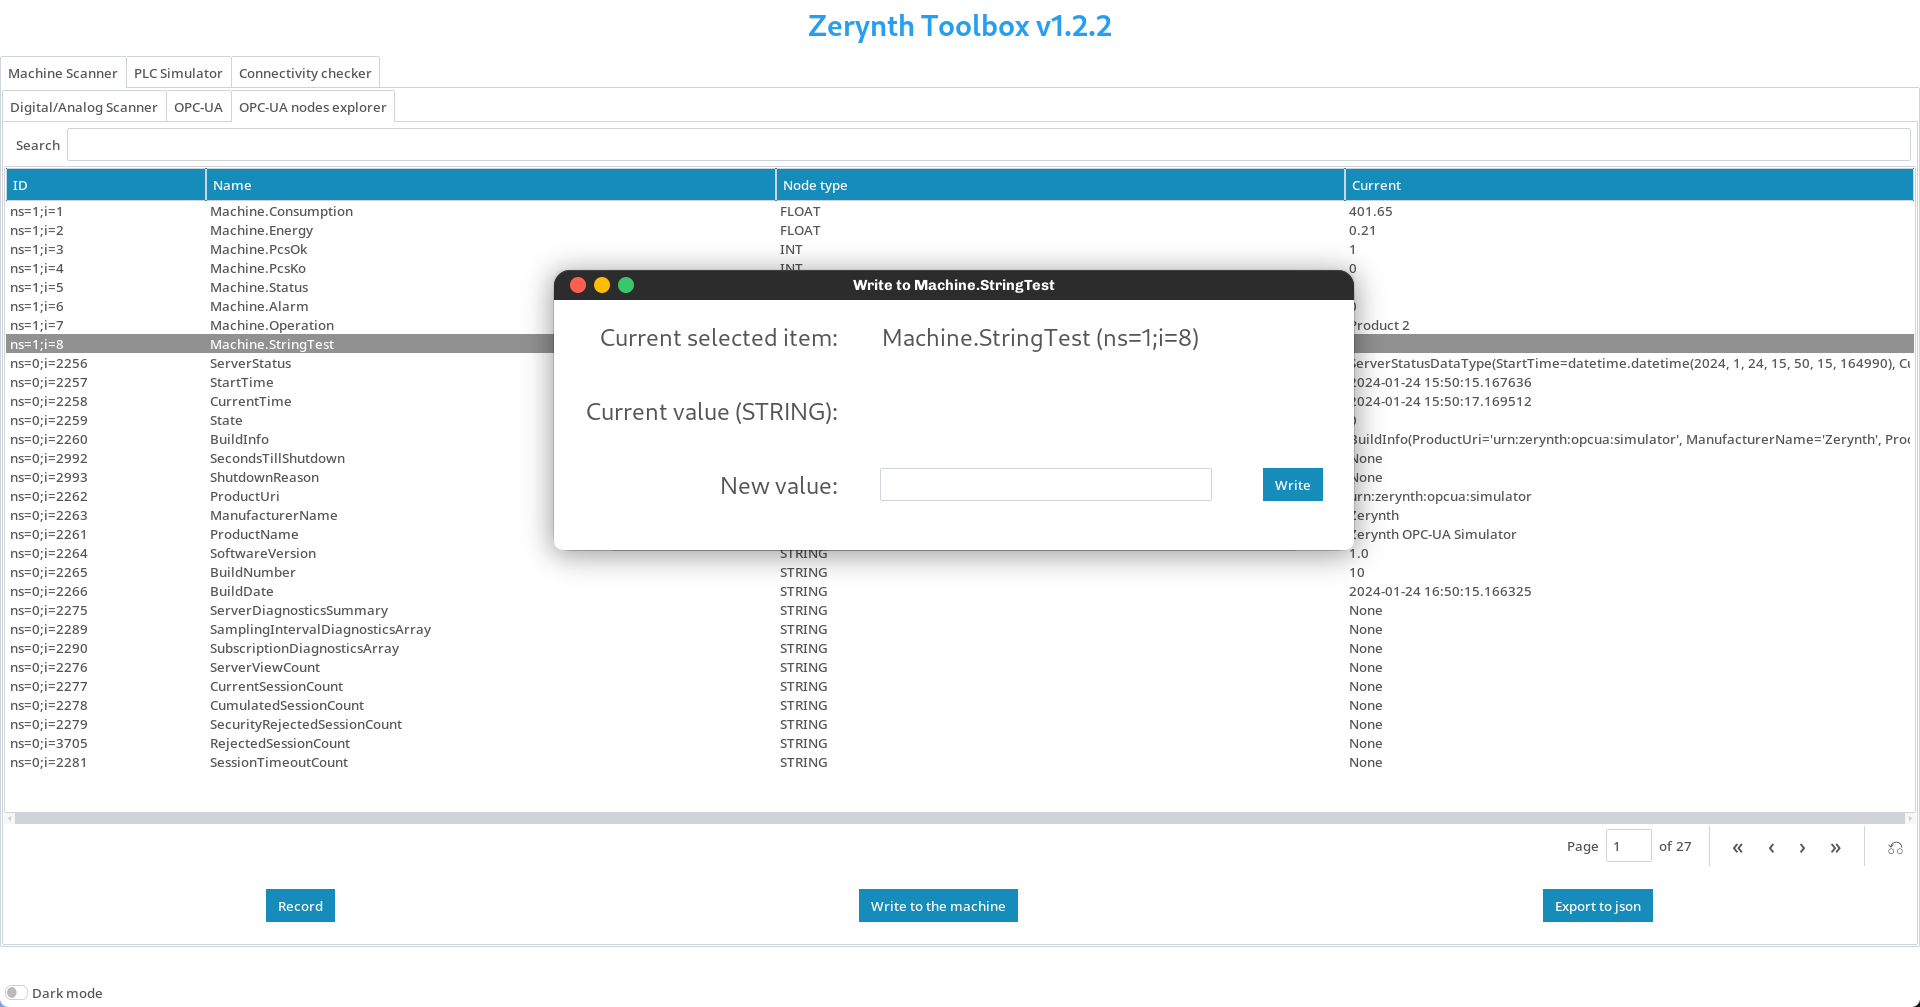
Now you can insert the new value and click write
PLC Simulator
The PLC Simulator can be used to simulate a production machine to test the ZeroAgent or to replay the data acquired from a real machine.
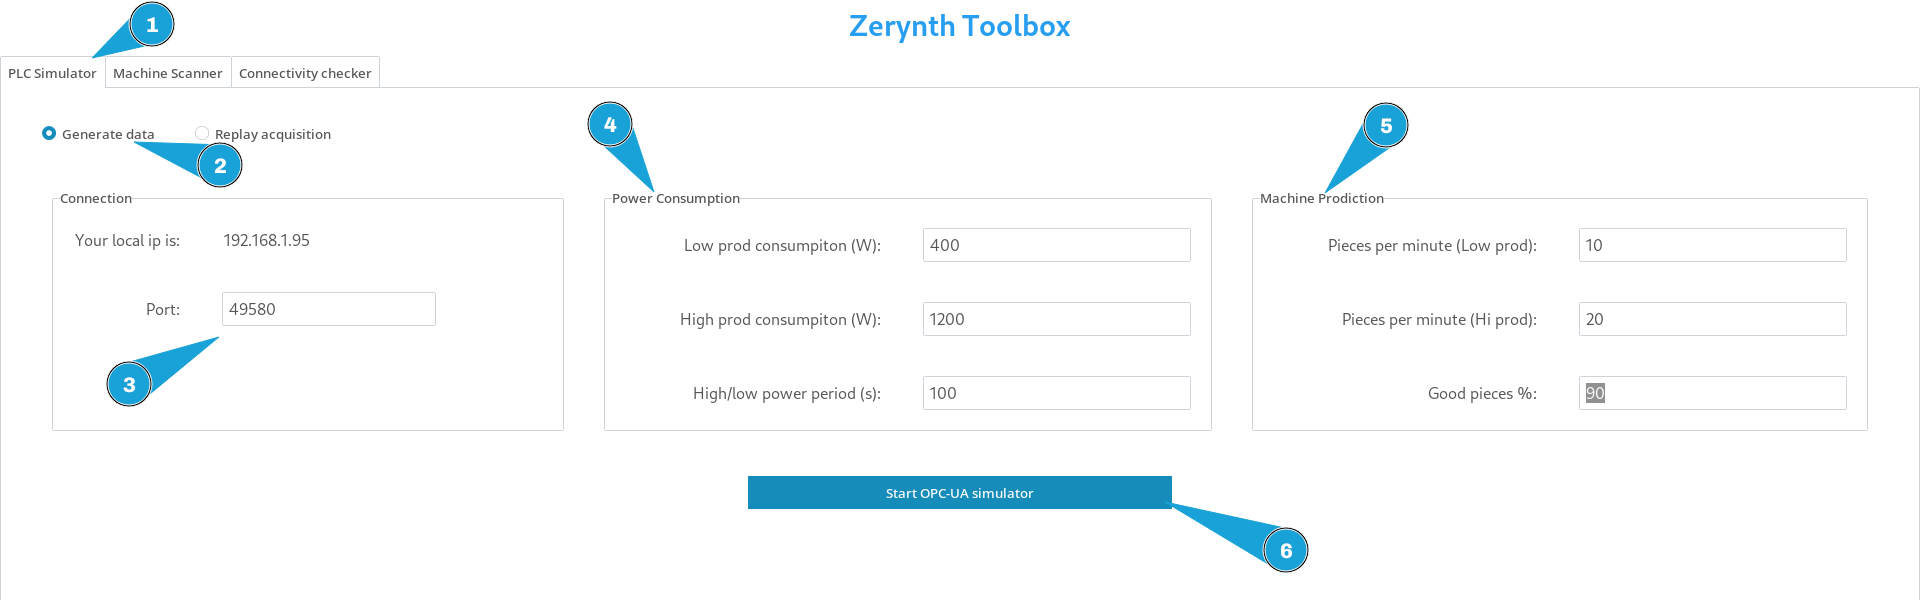
Data generation
To simulate a production machine click on the Generate data radio button.
The simulated machine operates between two power levels, changing the number of produced pieces and the operation tag accordingly.
Here's how to set up the machine:
- IP, Port: The IP and the port where the OPC-UA server is running. While the port is customizable, be sure to double-check the IP address as sometimes it can be incorrect (e.g. if the PC has 2 network interfaces, only one IP will be shown).
- Low prod consumption (W): the power consumption when the machine operates at the lower power level.
- High prod consumption (W): the power consumption when the machine operates at the higher power level.
- High/low power period (s): the period spent in each power level (e.g. if set to
10, the machine will switch level every 10 seconds). - Pieces per minute (Low prod): how many pieces are produced in the Low production level.
- Pieces per minute (Hi prod): how many pieces are produced in the Hi production level.
- Good pieces %: the percentage of good pieces produced.
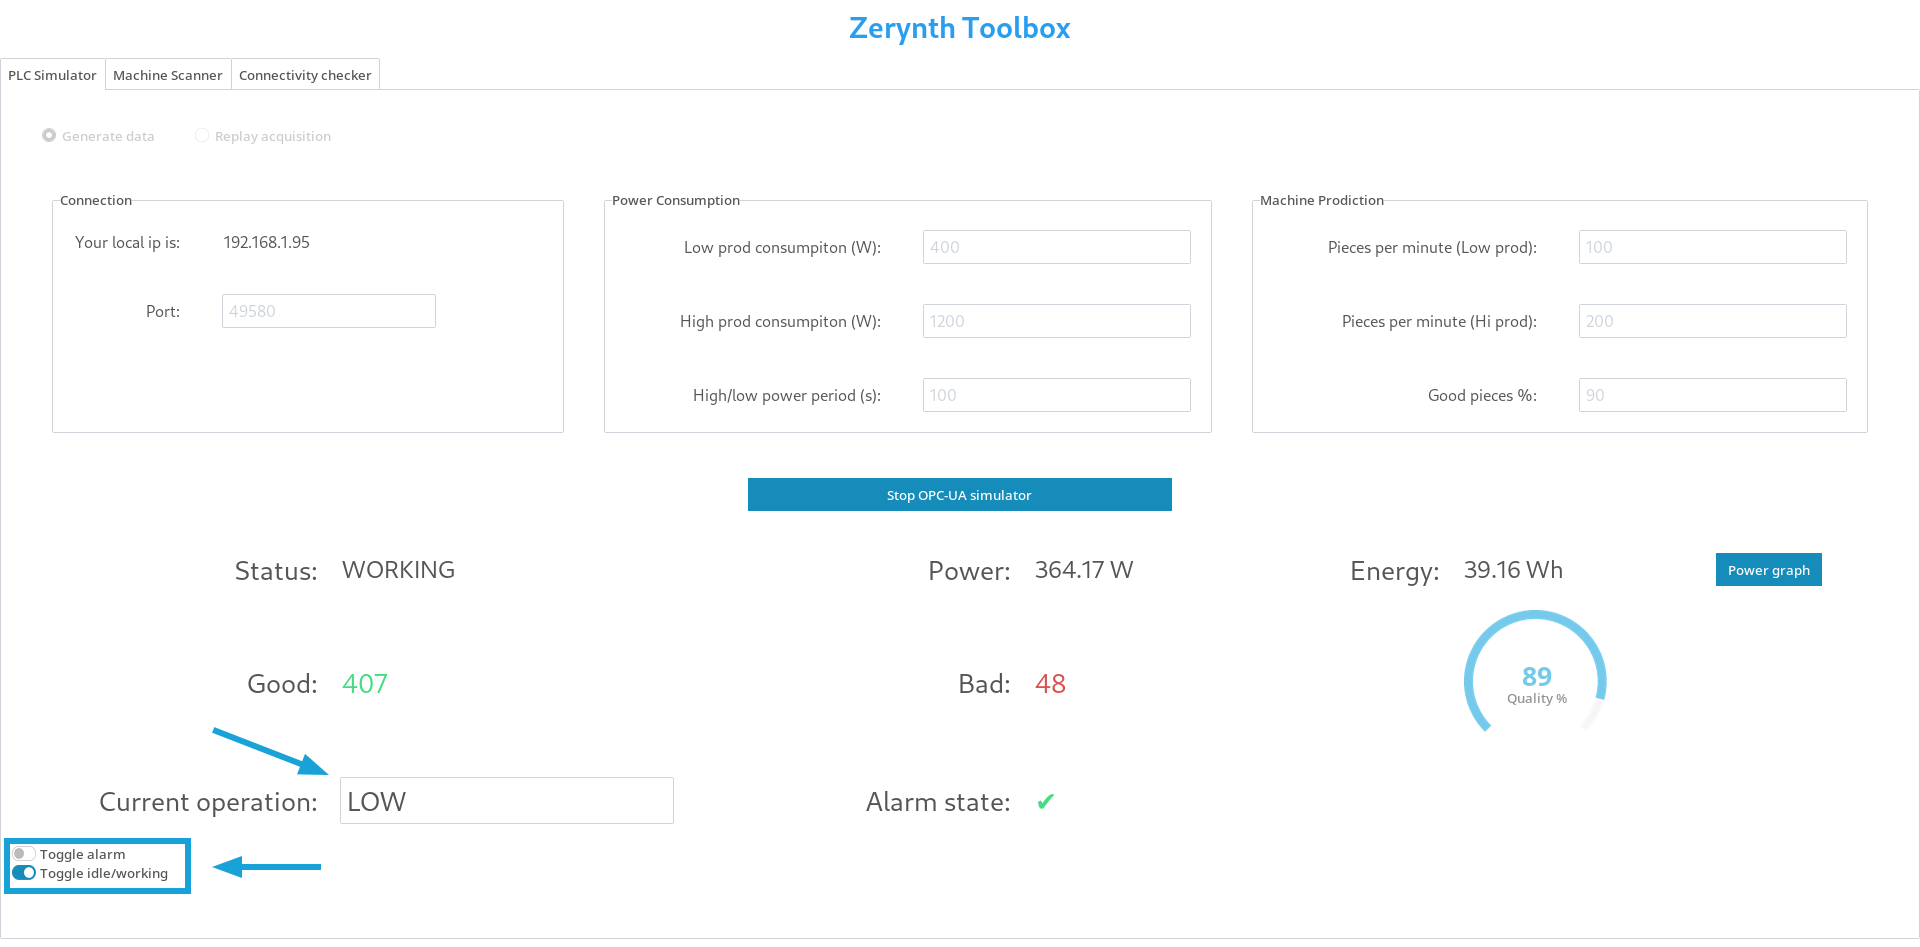
Once started, the operation can be changed using the textbox (it uses the default operation tags if left empty) and the state of the machine can be controlled with the toggles at the bottom left:
- Toggle alarm: this switch sets the machine in the alarm state
- Toggle idle/working: this switch sets the machine status. In the idle state the power consumption is automatically set to 1/4 of the
Low prod consumptionvalue
The OPC-UA server will expose the following nodes:
| Node ID | Node Name | Type |
|---|---|---|
| ns=1;i=1 | Machine.Consumption | FLOAT |
| ns=1;i=2 | Machine.Energy | FLOAT |
| ns=1;i=3 | Machine.PcsOk | INT |
| ns=1;i=4 | Machine.PcsKo | INT |
| ns=1;i=5 | Machine.Status | INT |
| ns=1;i=6 | Machine.Alarm | INT |
| ns=1;i=7 | Machine.Operation | STRING |
Replay acquisition
To replay an acquisition recorded using the , click on the Replay acquisition radio button, then click on the Load acquisition file button and select a valid CSV file.
Now you have to match the OPC-UA nodes with the correct CSV acquisition column.
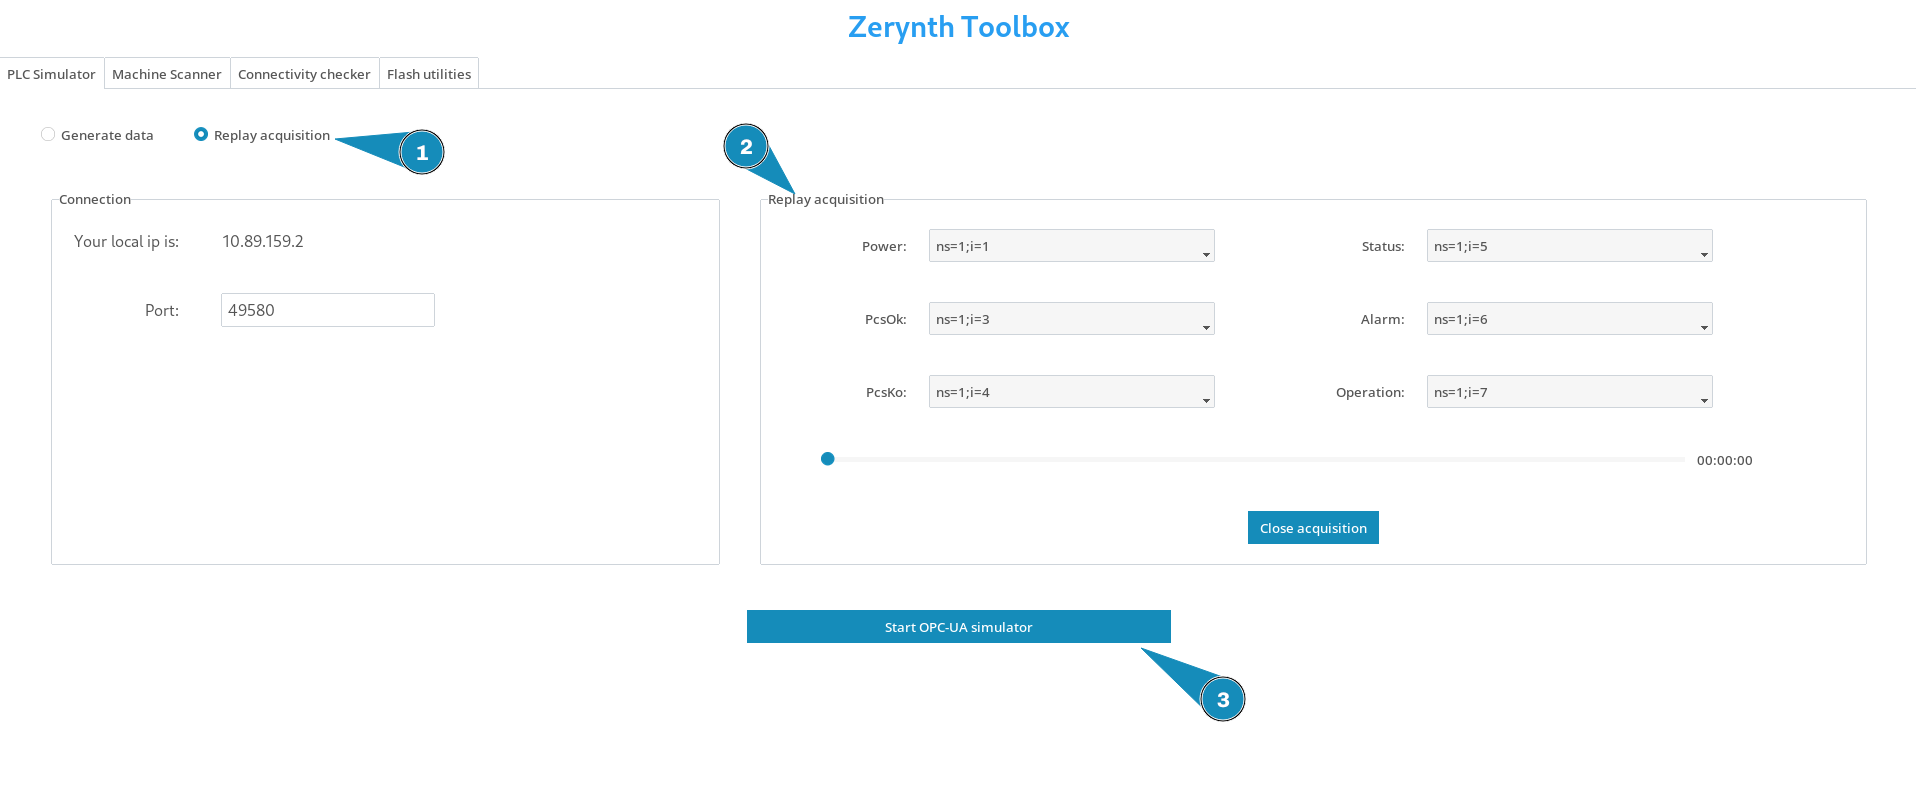
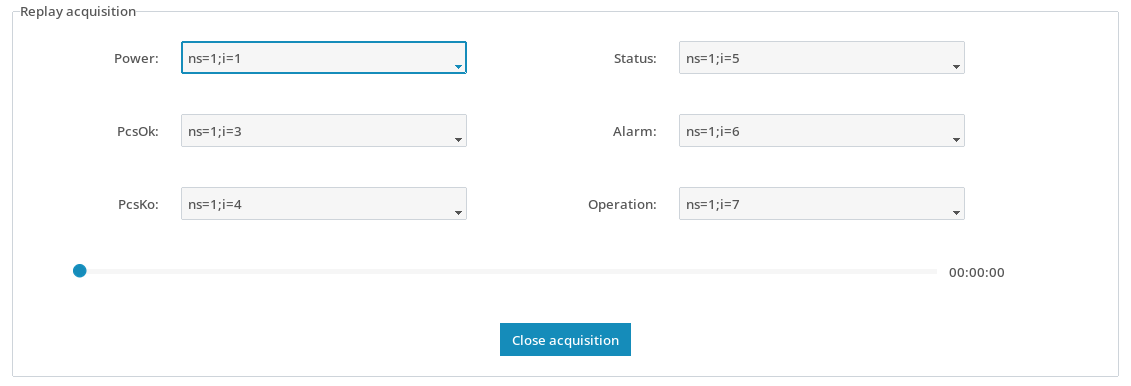
Now you can start the server to replay and scrub through the acquisition.
If a column contains an invalid value or if a node is not associated with any column, the node value will be set to 0 or "".
Connectivity Checker
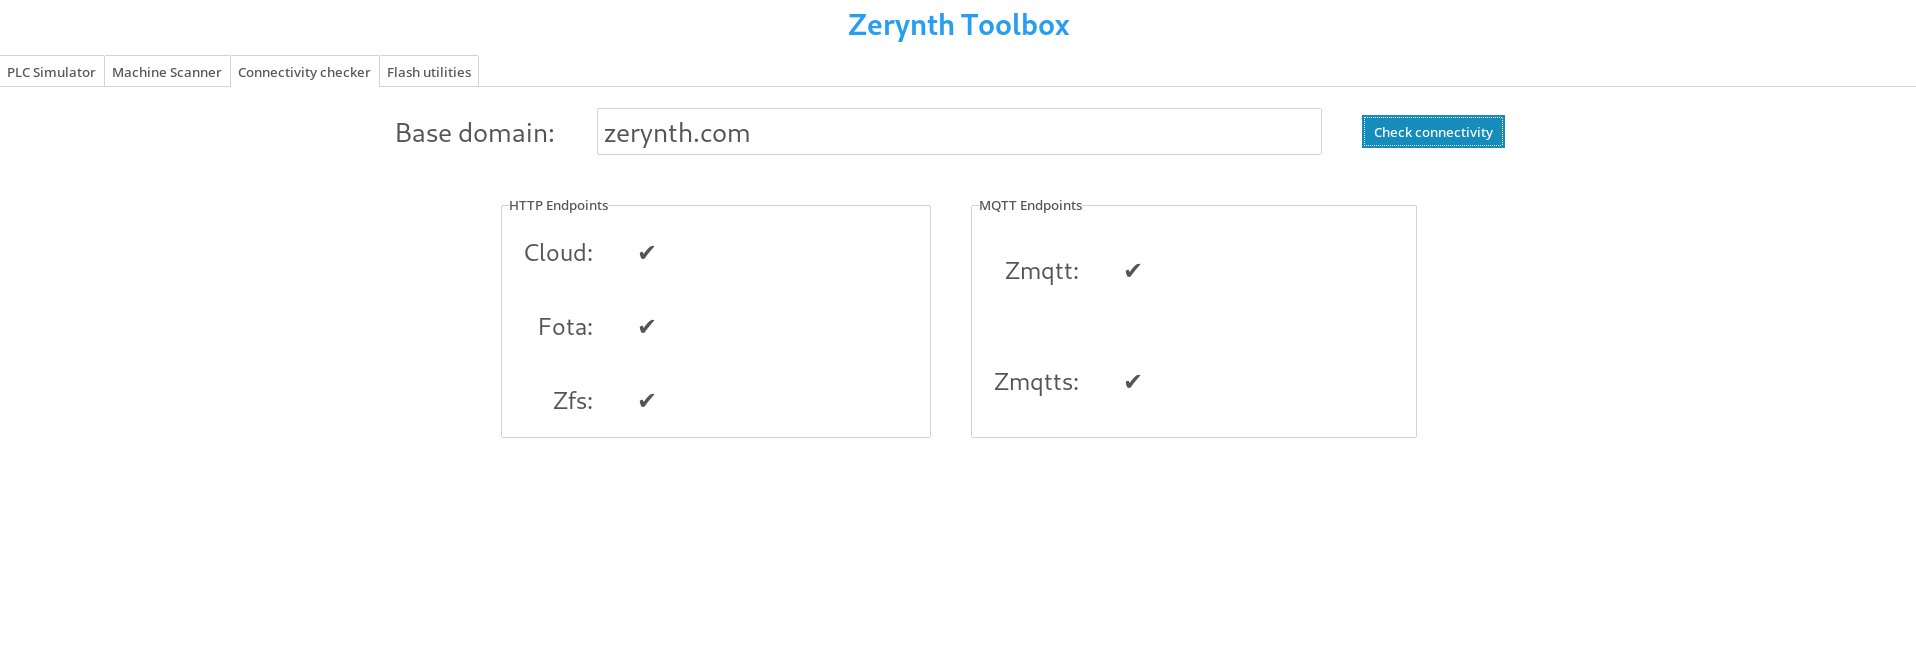
This tool is useful to check whether the cloud endpoints are reachable and up.
If everything is ok you should see something like this
Otherwise, you should see an error to the offline endpoints
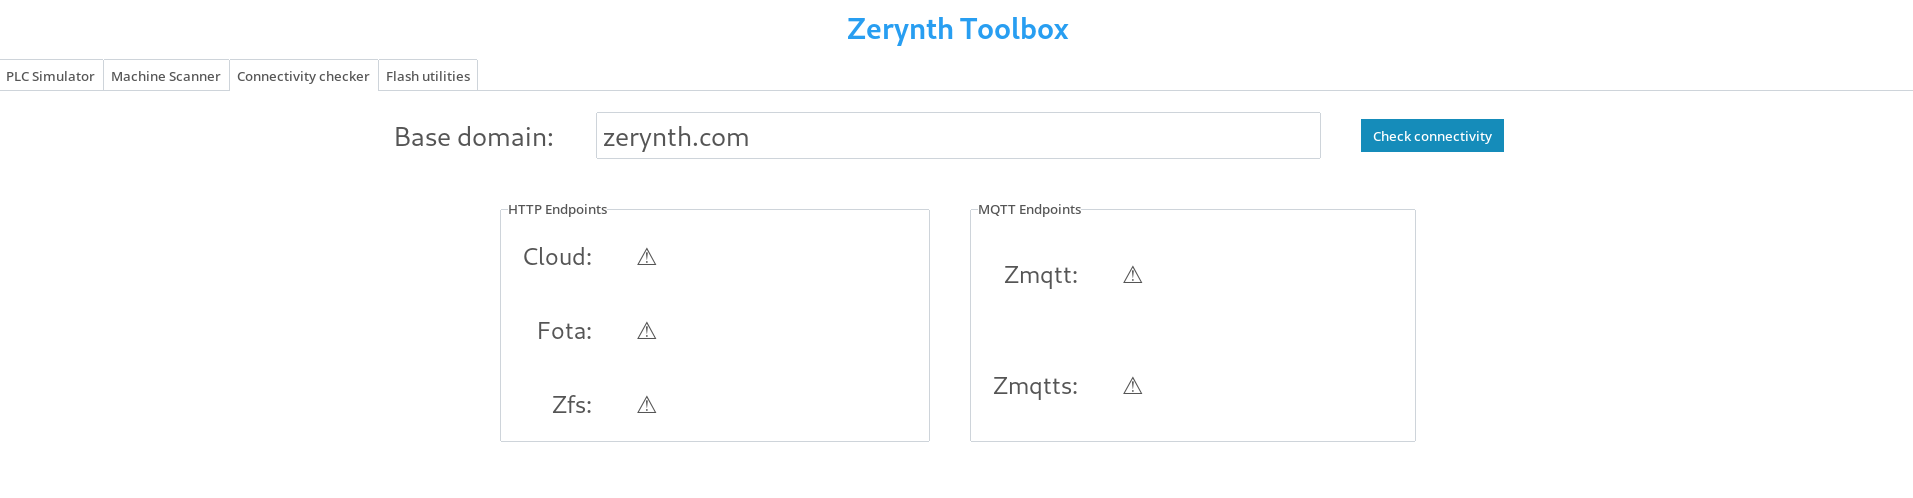
Make sure to connect the PC to the same network to which the device will be connected.
Get Started
For practical information on configuring and field testing the Zerynth system, we recommend checking the Get Started section section of this documentation. There, you'll find details on how to use OPC for testing the system and initiate your hands-on experience.