Consumption
Introduction
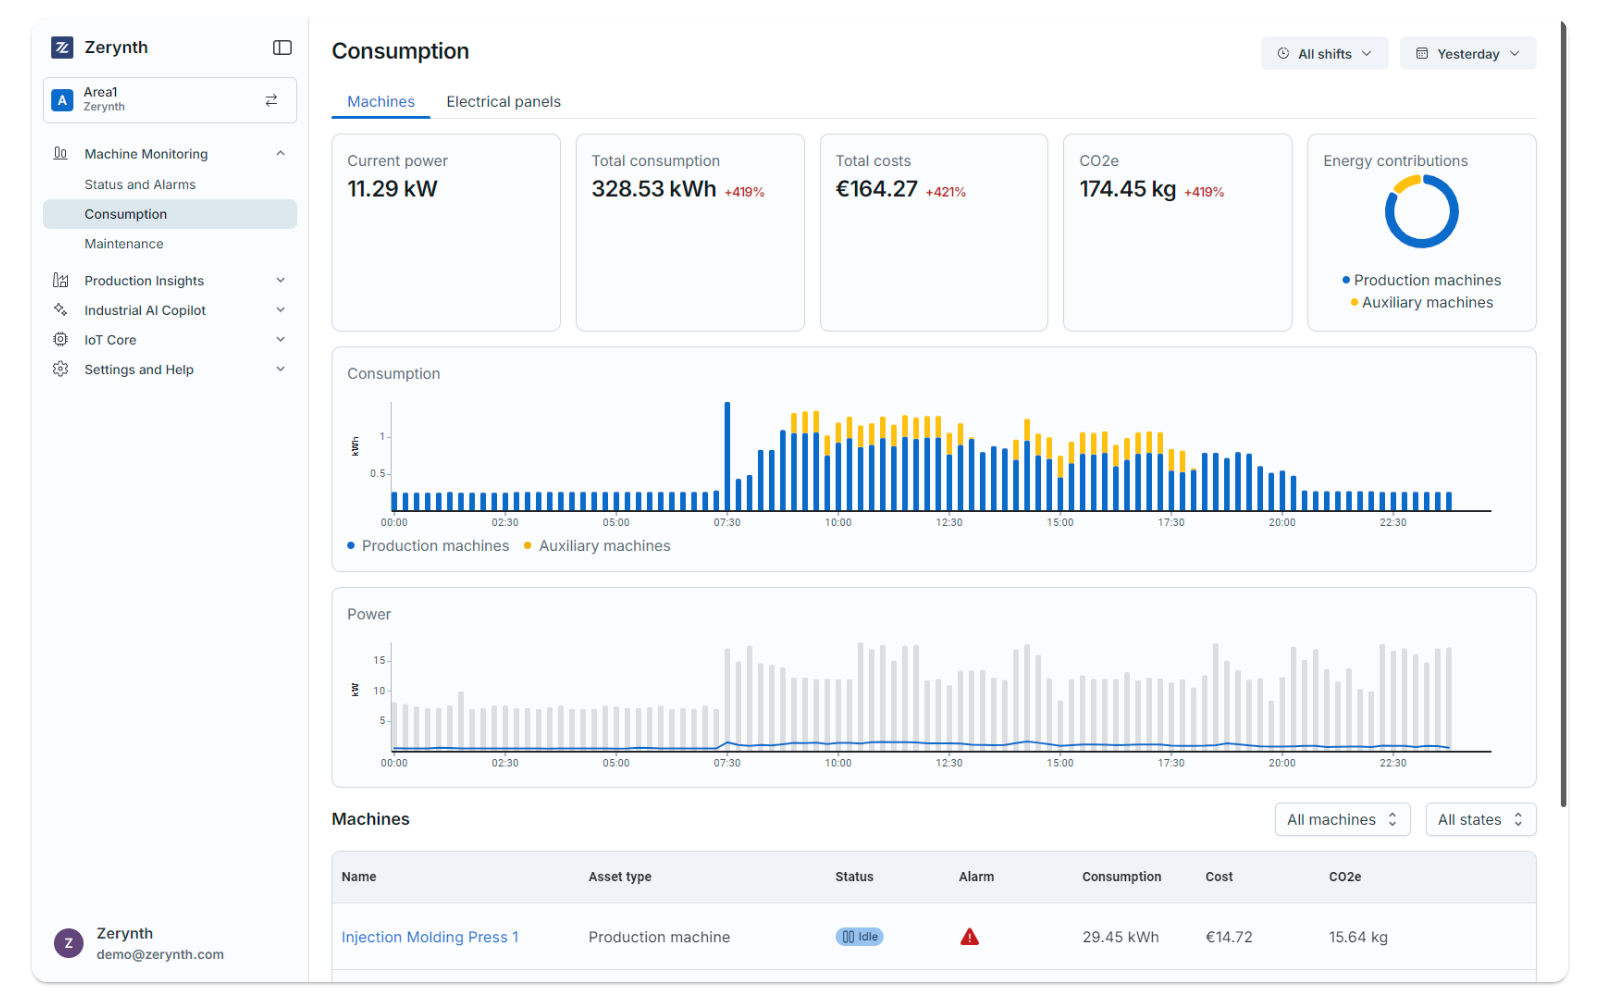
The Consumption section in the Machine Monitoring pp provides detailed information on the operating conditions of monitored industrial assets, focusing on:
- Operating states and alarms
- Energy consumption and associated costs for both machines and areas/buildings
The app categorizes monitored assets into industrial machinery (both production and auxiliary) and electrical panels. This categorization allows for comprehensive energy efficiency analysis and informed decision-making using various tools and KPIs.
The Consumption section is organized into two categories:
- Machines
- Electrical Panels
Single Machine
By clicking on a machine name, you will be redirected to a detailed consumption page for that specific machine.
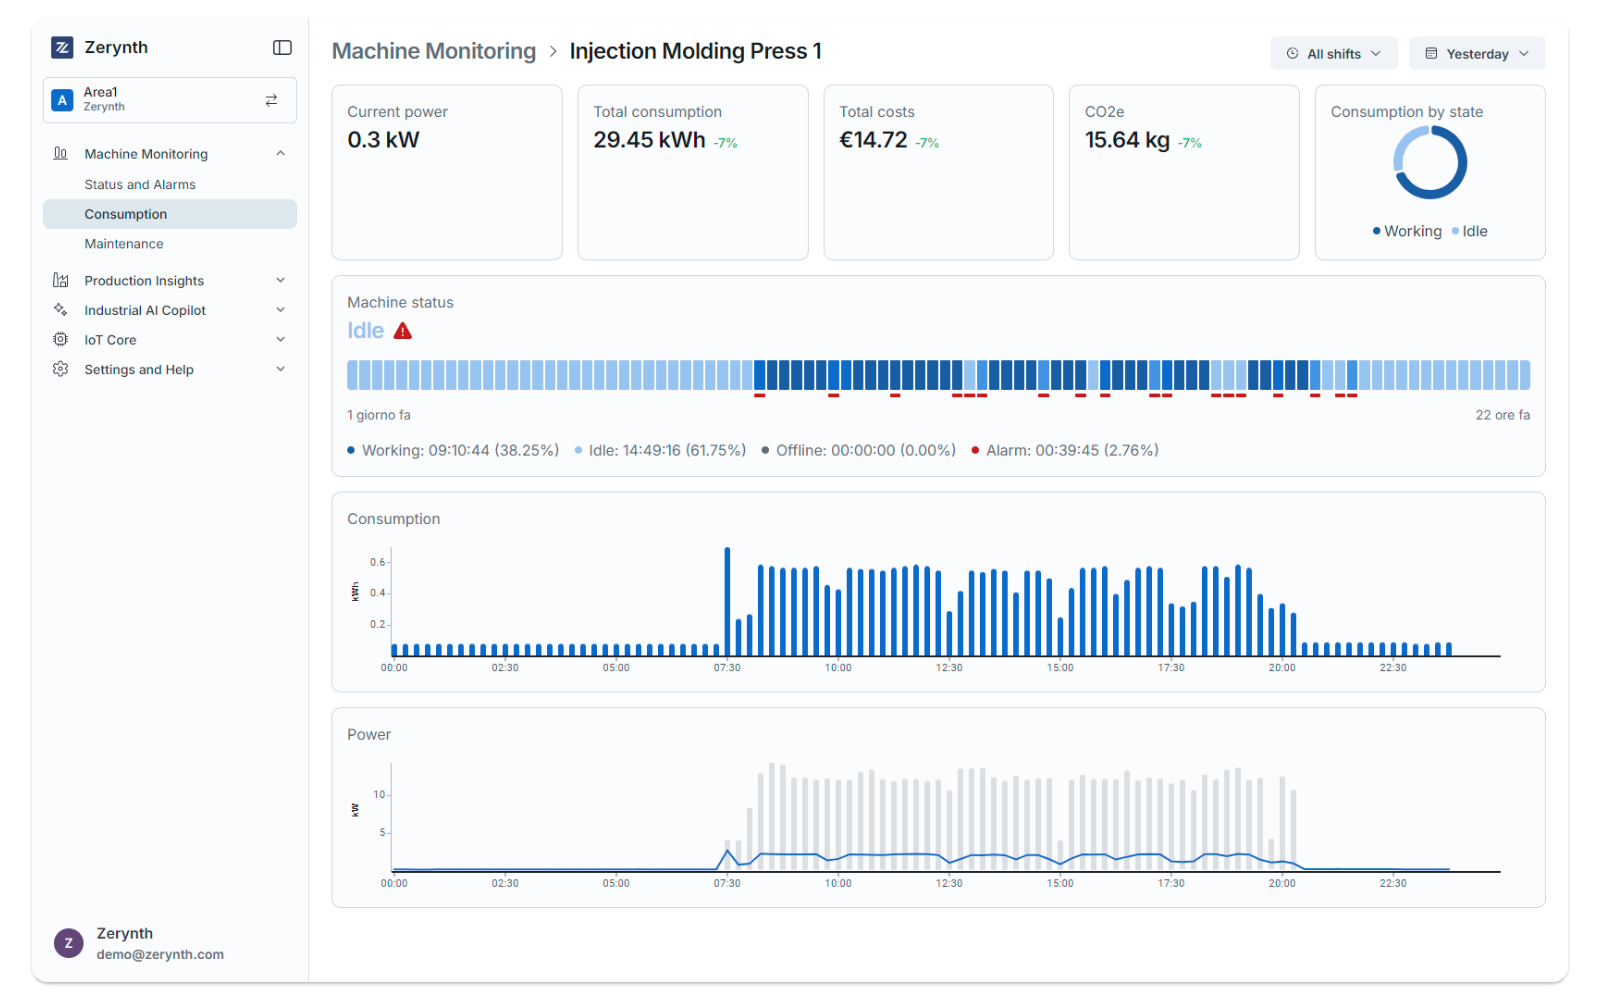
This page provides detailed information for the selected machine within the specified time range.
At the top of the page, overview panels display key data:
- Current machine status: Indicates whether the machine is working or idle.
- Current power: Displays the machine’s current power consumption.
- Total consumption: Shows the total energy consumption within the selected time range.
- Total costs: Displays the total costs for the selected time range, calculated using the configured currency and energy rates (check the Settings page for more details)
- Consumption by status: A pie chart detailing energy consumption for each machine status.
Both consumption and costs include a delta percentage on the card, indicating changes from the previous period of the same length. The delta is color-coded: green for a decrease (lower consumption/costs), red for an increase (higher consumption/costs), and grey for no change.
Below the overview cards, a timeline shows the machine’s status history over the selected period.
At the bottom, a chart presents the machine’s energy consumption for the selected time range.
Electrical Panels
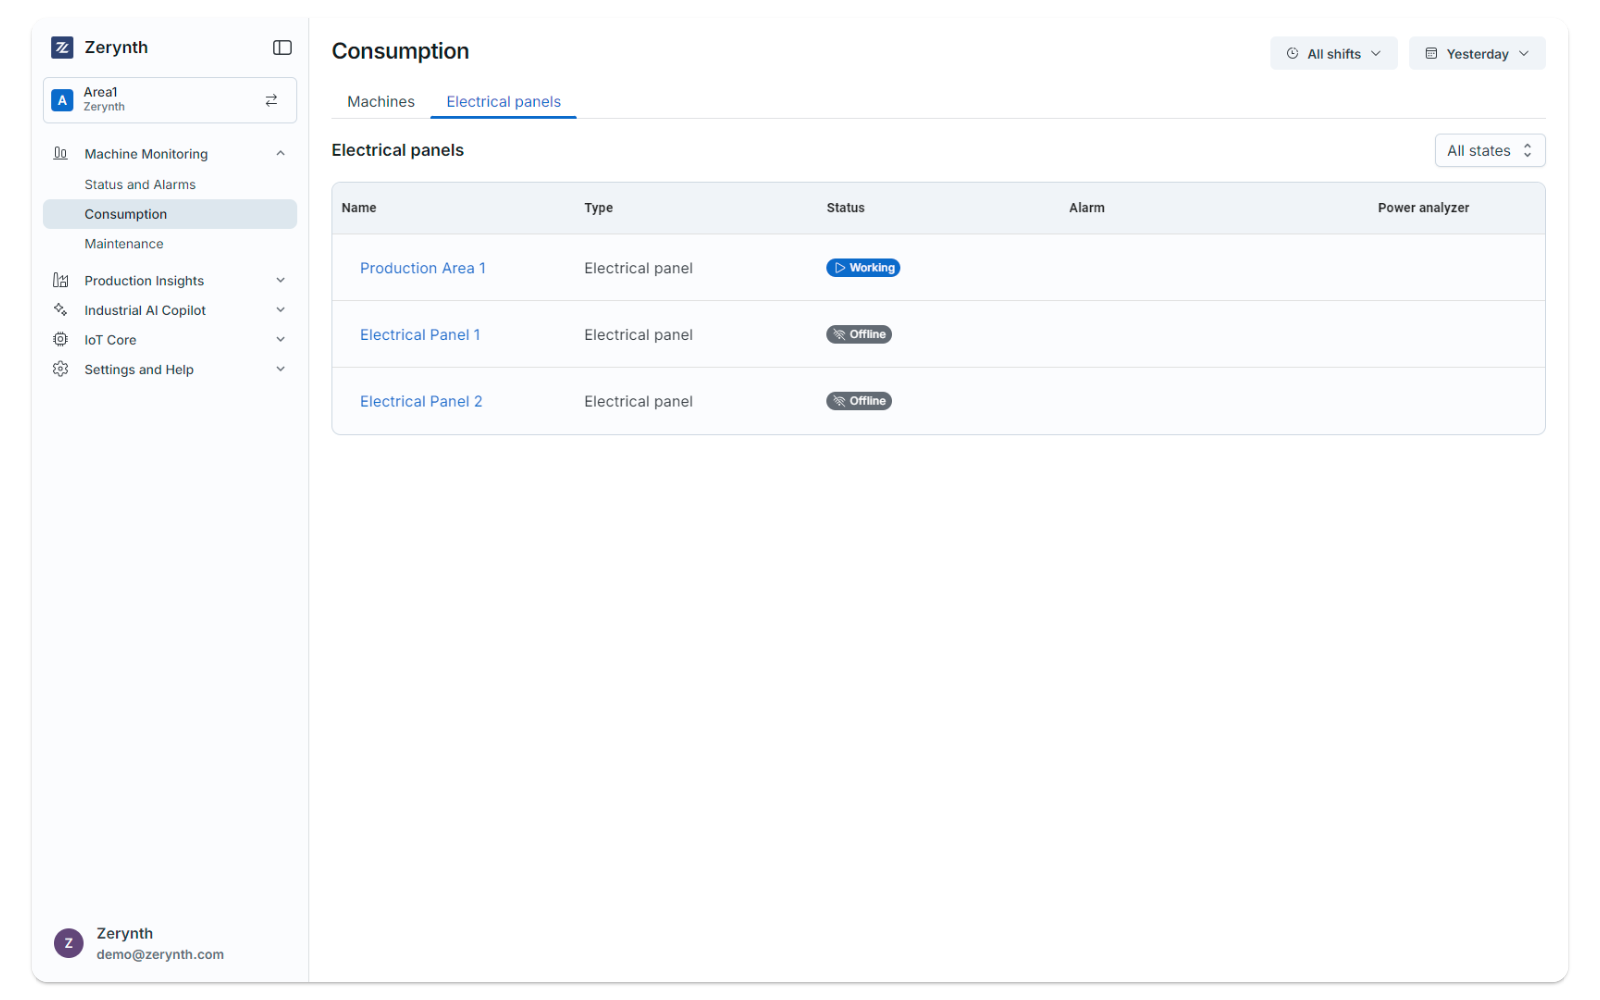
The Electrical Panels section enables users to monitor and manage alarms and status for specific zones or areas.
Overview
In the top-right corner, you can select the desired time range.
For additional information, refer to the Knowledge Base.
The main page displays a table listing all electrical panels in the Workspace, with the following details:
- Panel name: Assigned by the user upon creation.
- Panel type: Currently supports “Electrical Panel” only.
- Status: Indicates whether the panel is working or disconnected.
- Alarm: Displays an alert icon if the panel has an active alarm.
- Power Analyzer: Shows an icon if the panel is connected to a Power Meter for more accurate consumption readings.
Single Panel
Clicking on a panel name takes you to a detailed view.
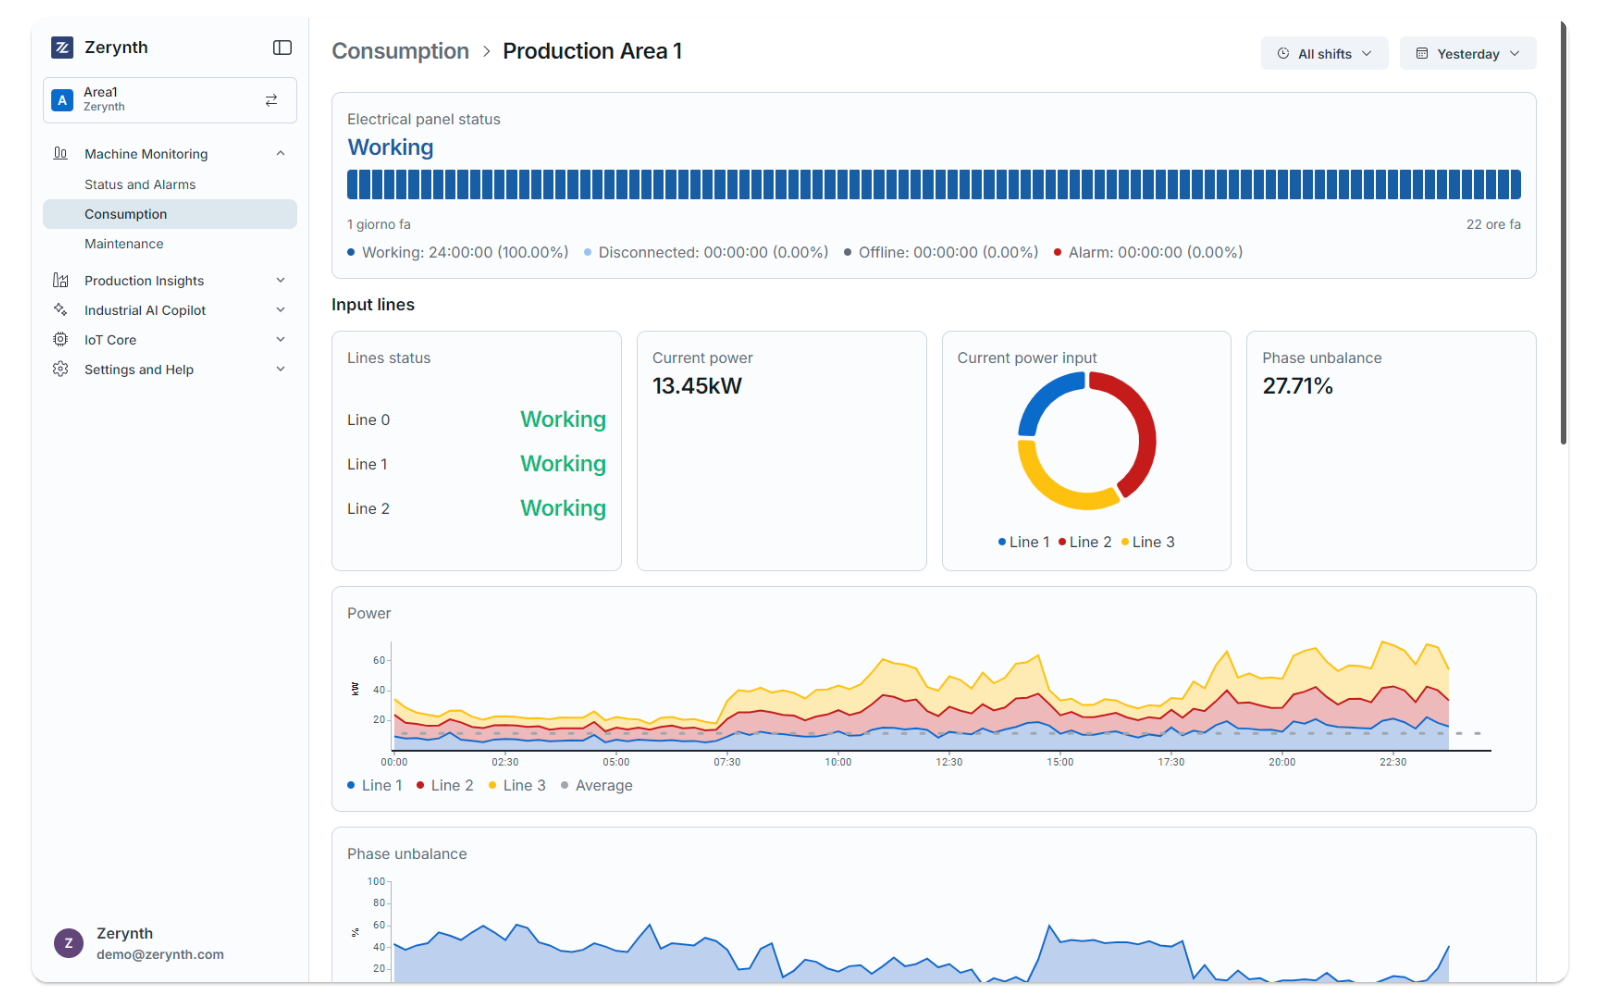
At the top of the page, two rows of cards provide overview information about the panel’s input and output lines.
Input Lines Cards:
-
Overall status: Displays as "Working" or "Disconnected". If any line is disconnected, the overall status is "Disconnected"; otherwise, it is "Working".
-
Line status: Small dots represent individual input lines, colored grey if disconnected and green if working.
- A line is considered disconnected if it absorbs less than 5% of its maximum power.
-
Phase unbalance: Shows the percentage of phase unbalance between the lines.
- Available only when a Power Analyzer is installed.
Output Lines Cards:
- Current power consumption
- Total power consumption within the selected time range
- Total costs within the selected time range, based on the configured currency and energy rates
- Consumption distribution among the lines
Electrical Panels Cabinet Status
A timeline shows the panel’s status and alarms within the selected time range, using green for Working, grey for Disconnected, and red for Alarm.
Consumption
A chart displays the energy consumption over the selected time range.
At the bottom of the page, a list view provides detailed information about the output lines, including:
- Line name
- Line status
- Alarms status bar: A bar visualizing the occurrence of alarm conditions over time. Multiple alarms are shown as parallel lines.
- Energy consumption within the selected time range
- Total cost within the selected time range, based on the configured currency and energy rates
Refer to the Settings page for more details.
Single Line
Clicking on an output line’s name redirects you to a detailed view of that specific line.
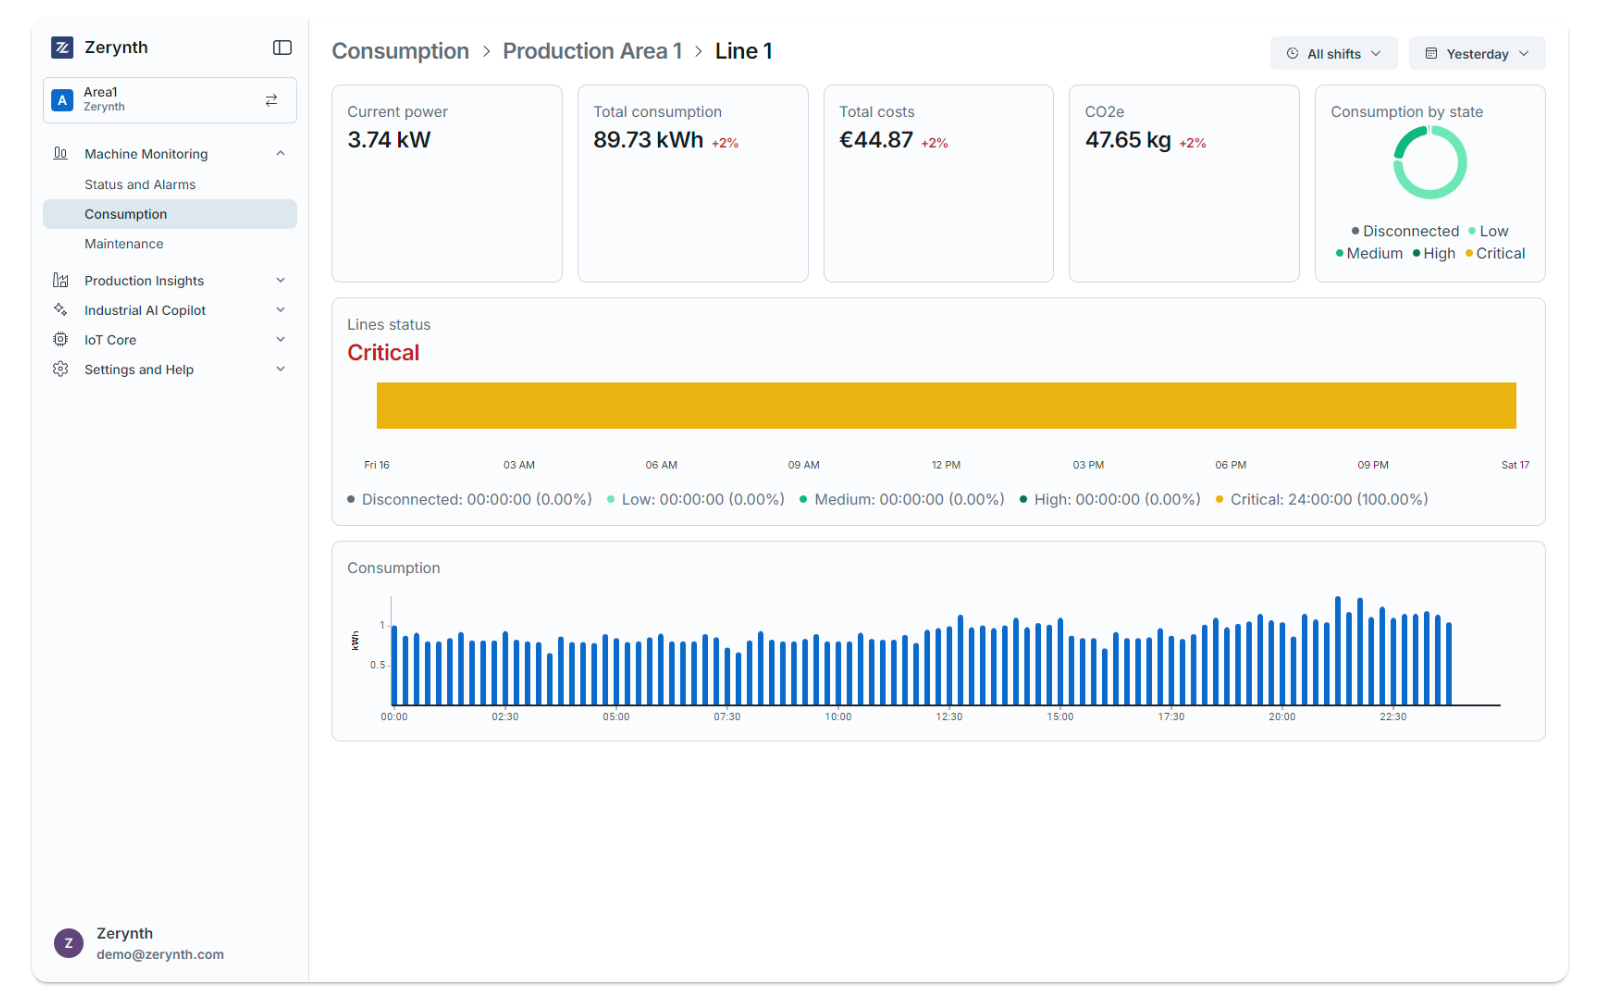
This page includes a header with key information about the electrical panel cabinet:
- Electrical panel cabinet status
- Current power
- Total consumption within the selected time range
- Total costs within the selected time range, based on the configured currency and energy rates
- Consumption by state: A pie chart showing energy consumption distribution by cabinet status
Below the overview cards, a timeline shows status distribution during the selected time range, accompanied by a chart illustrating energy consumption.