Operations
In Zerynth Production Insights, the concept of an operation is redefined to focus on specific machine conditions rather than traditional production or work orders, such as customer codes, batches, or job numbers. This perspective allows users to evaluate machine performance within its unique operational context.
For example, a machine may perform differently depending on the tools it uses, the settings applied, or the materials processed. By taking these variables into account, users can analyze performance metrics—such as Overall Equipment Effectiveness (OEE), Performance, and Quality—more precisely, providing insights that are more actionable than aggregated data.
Introduction
The Operations Application provides detailed information about the operations executed in the workspace. The application is structured into two tabs:
- Overview: The first tab provides an overview of the operations running in the workspace at any given time.
- Operations: The second tab offers a detailed description of the operations and their data.
The Operations tab allows access to a section that provides detailed information about individual operations executed on the production machines, characterizing your manufacturing process and providing the following two KPIs:
- Quality: Calculated as the percentage ratio between the number of cycles/pieces completed while executing a specific operation across machinery and the cycles/pieces classified as defective over a specified time interval.
- Performance: Calculated as the percentage ratio between the ideal cycle time associated with that specific operation worked on that machinery and the measured cycle time over a specified time interval.
Note:
- Defective cycles/pieces can only be measured if the monitored machinery allows for it.
- The ideal cycle time is a value manually set in the SETTINGS menu for a specific operation, and it can vary depending on the selected machinery.
In the Operations section, the Efficiency KPI is also calculated as the product of the two above-mentioned KPIs:
Efficiency = Quality x Performance [%]
The Operations page section is divided into two main parts:
- Overview: Provides aggregated info and KPIs at the plant/fleet level.
- Operations: A table reporting details for each operation.
Overview
The first part has five rows of cards.
In the first row, the following information is available:
- Efficiency: The product of Performance (relationship between Average Cycle Time and Ideal Cycle Time) and Quality (relationship between Good Cycles and Total Cycles).
- Average Performance of the machines in the workspace.
- Average Quality of the machines in the workspace.
- Cycles: The total number of cycles of the operations.
- Average Cycle Time
- Average Cycle Energy Cost
- Highlights: A table containing the most important details of each operation, such as name, average cycle time, cycles, and efficiency. By clicking a highlight's name in the table, you will be redirected to the Operation's detail page, as described below.
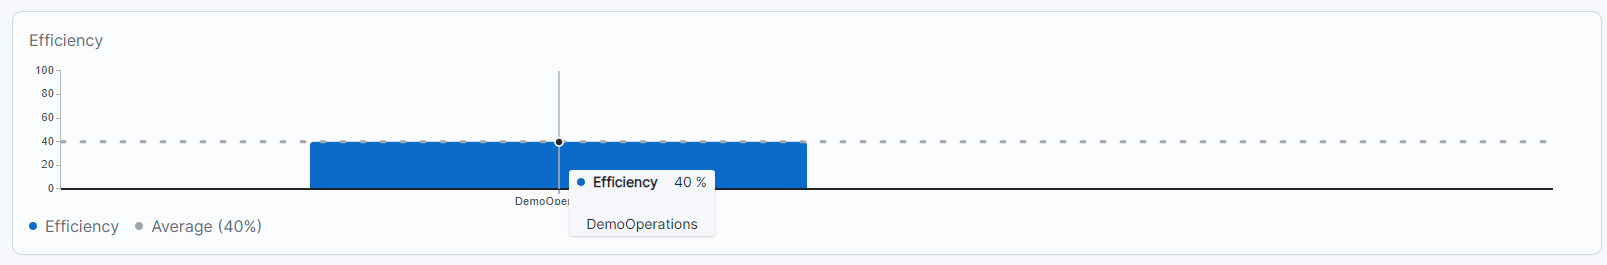
The card in the second row contains the efficiency per operation and the effectiveness of each operation, with an indication of the average:
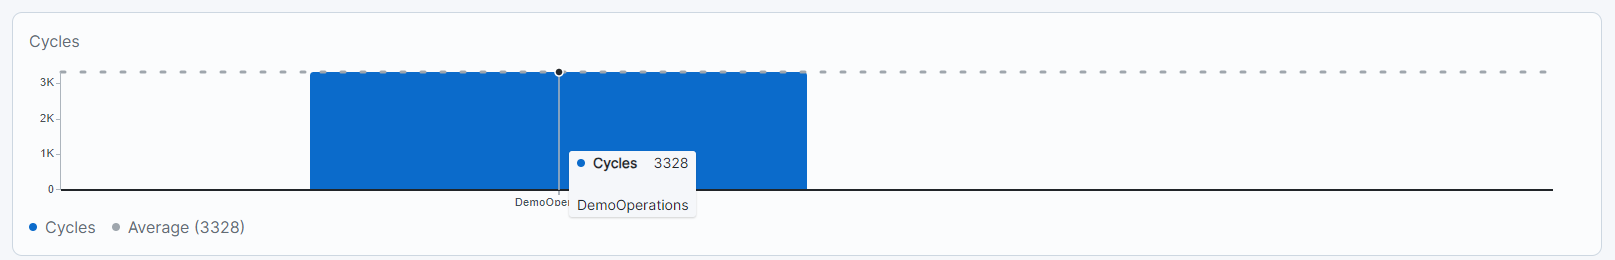
The card in the third row contains the total number of cycles for each operation:
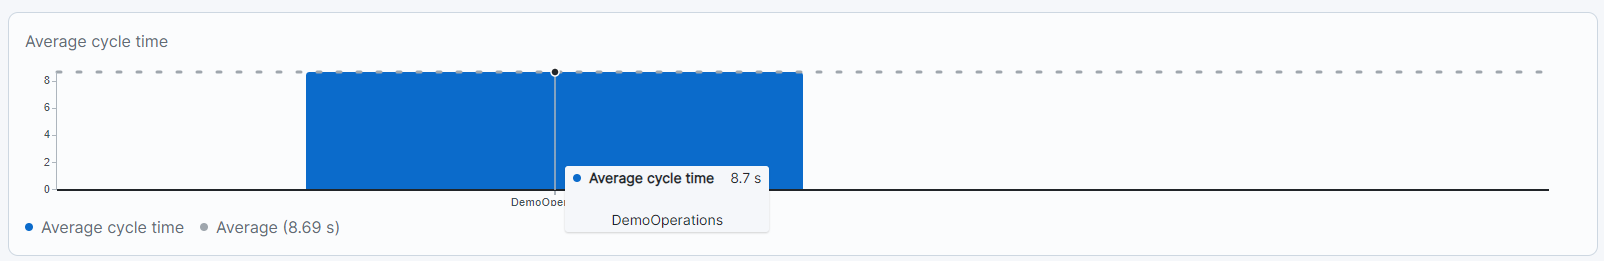
The card in the fourth row contains the Average Cycle Time (ACT) for each operation:
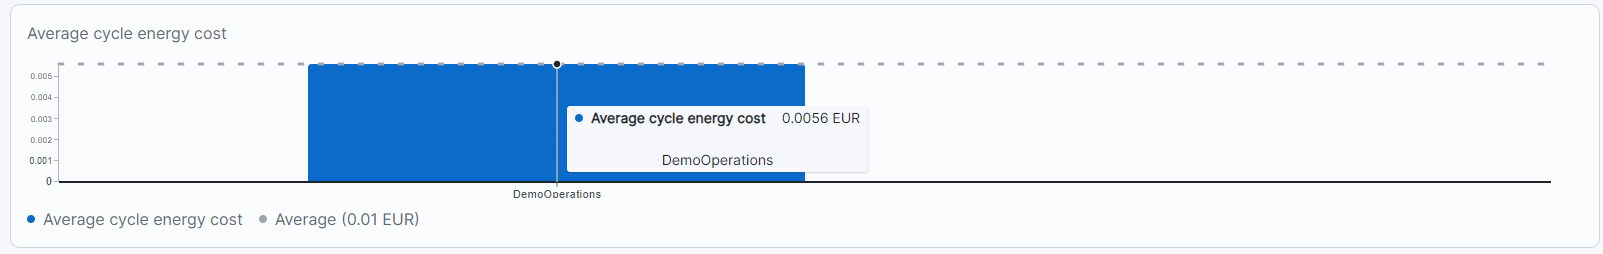
The card in the fifth row contains the Average Cycle Energy Cost, which is the average cost of electricity for each working cycle.
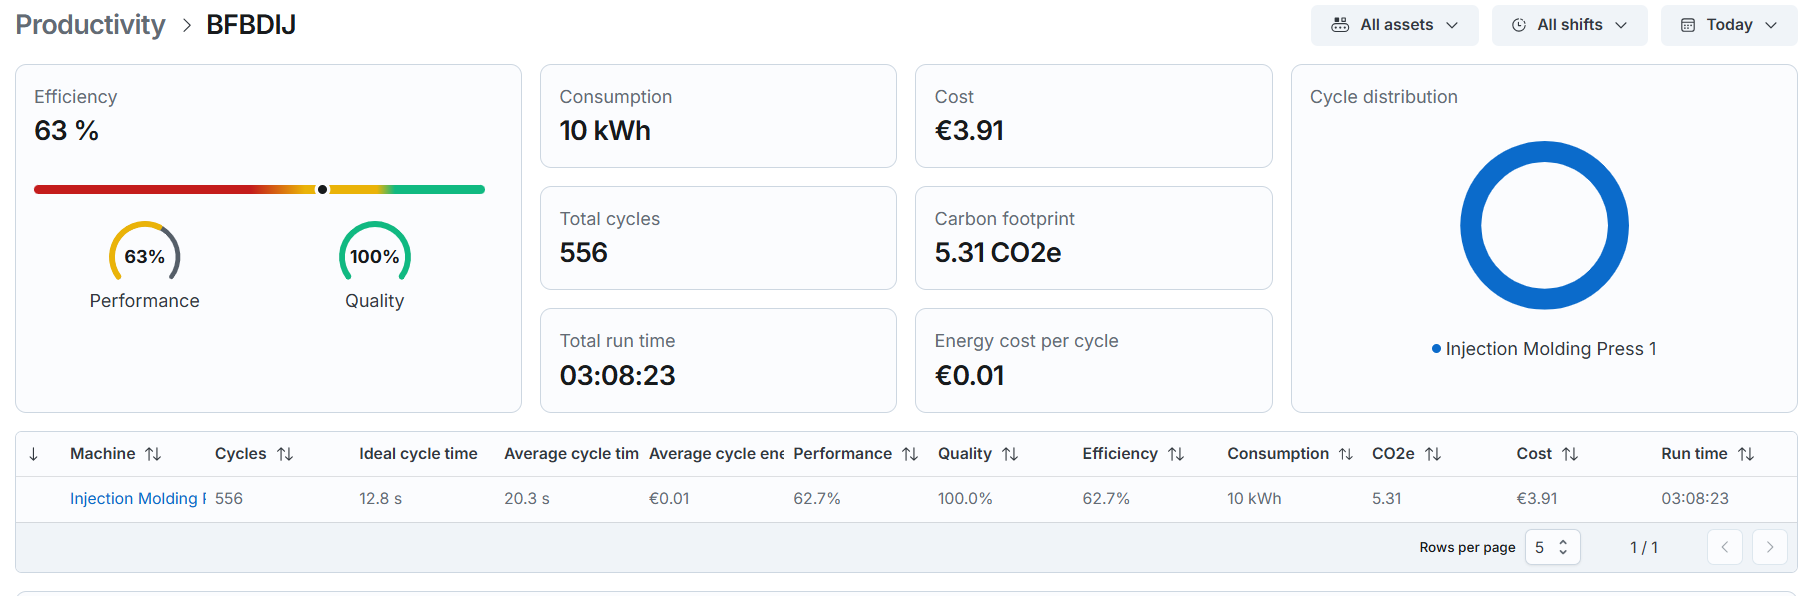
By clicking an Operation's name in the table, you will be redirected to the Operation's detail page, as described below.
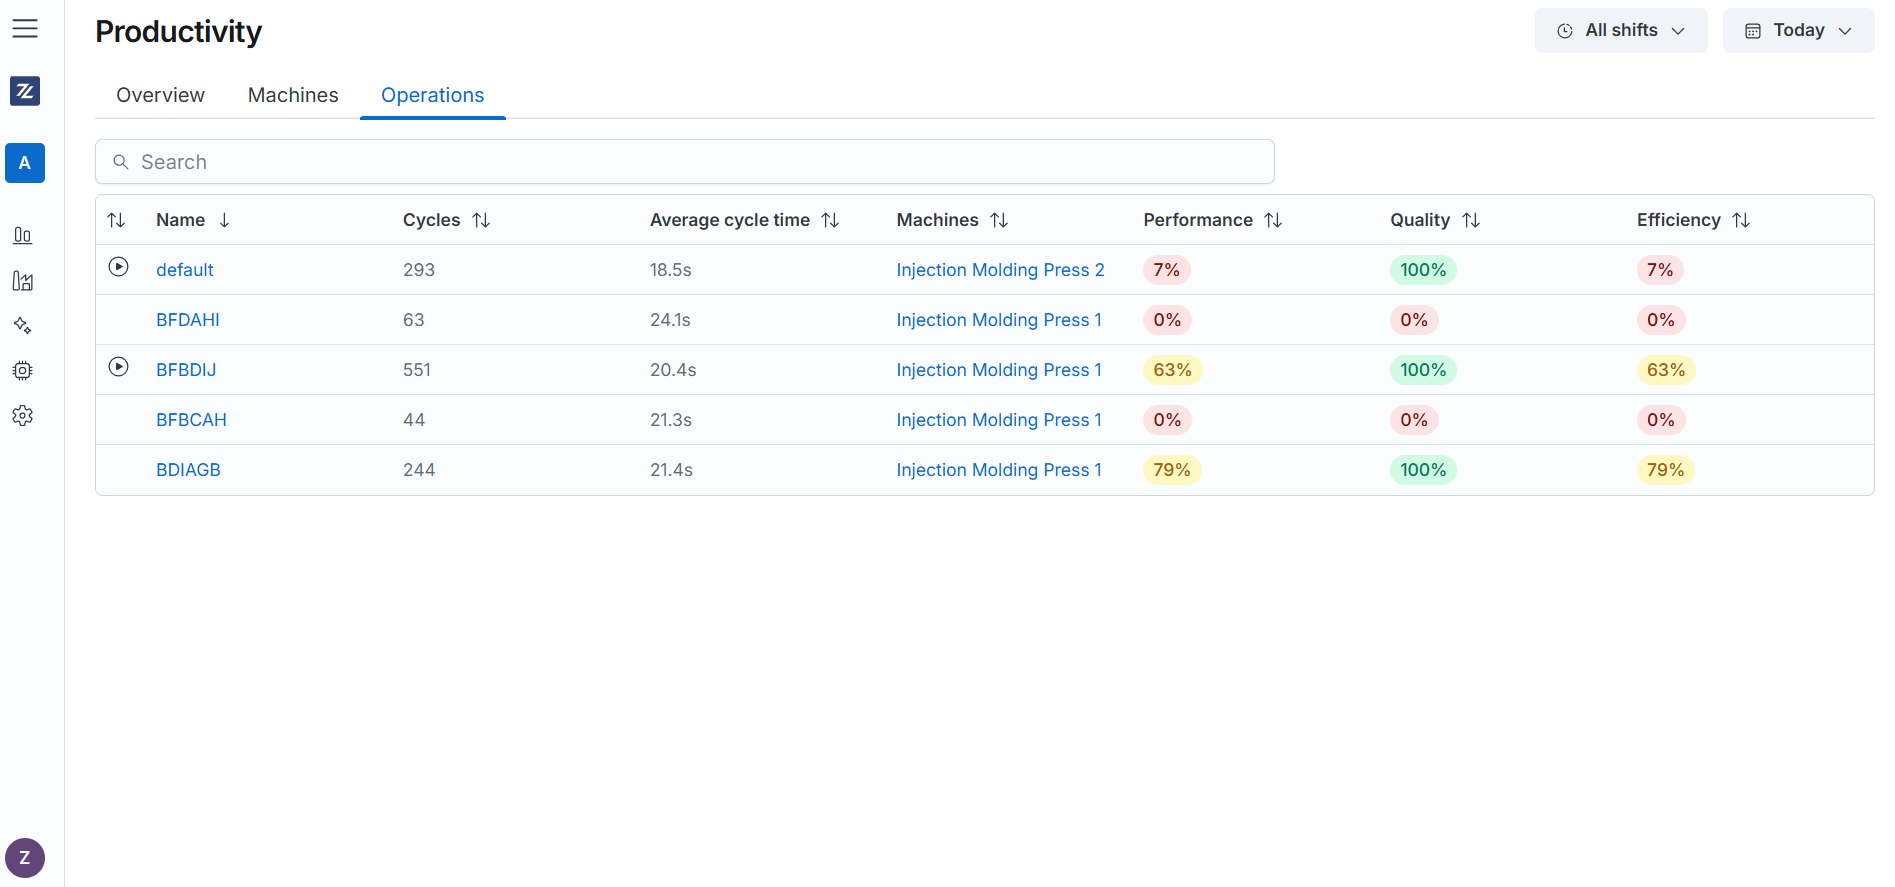
Operations
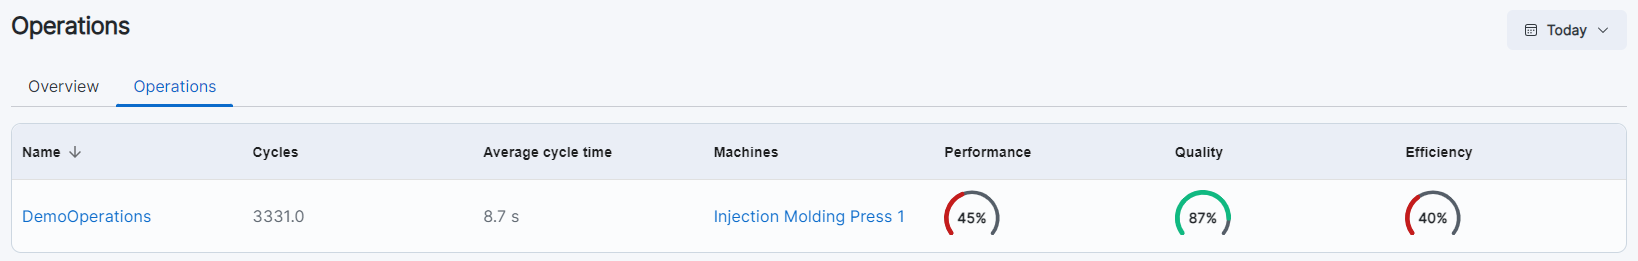
In the Operations tab, you will find a recap table with an entry for each operation, where the following information is available:
- Name
- Cycles: The total number of cycles executed for the single operation.
- Average Cycle Time (ACT)
- Machines: The machines currently executing the operation.
- Performance: The relationship between average cycle time and cycle/item production.
- Quality: The relationship between Good Cycles and Total Cycles.
- Efficiency: The product of Performance and Quality.
By clicking an Operation's name in the table, you will be redirected to the Operation's detail page, while clicking on a Machine's name will redirect you to its productivity detail page.
In the absence of tracking OPERATIONS (because they are not intended to be managed, preferring a machine-level productivity analysis, or in cases where such OPERATIONS have never been tracked for a machine), the system will assign a generic one, labeled as "default".
Attention: Until an ideal cycle time (per machine) is manually indicated for this default operation, the relevant KPIs (including PERFORMANCE) will not be calculated for it. Additionally, even when such an ideal cycle time is configured, the KPIs for data preceding the configuration date will not be updated.
Operations Tracking
The Operations Tracking section in Zerynth Production Insights provides detailed information on the actual start and end of each specific operation performed on production machines within a selected time frame.
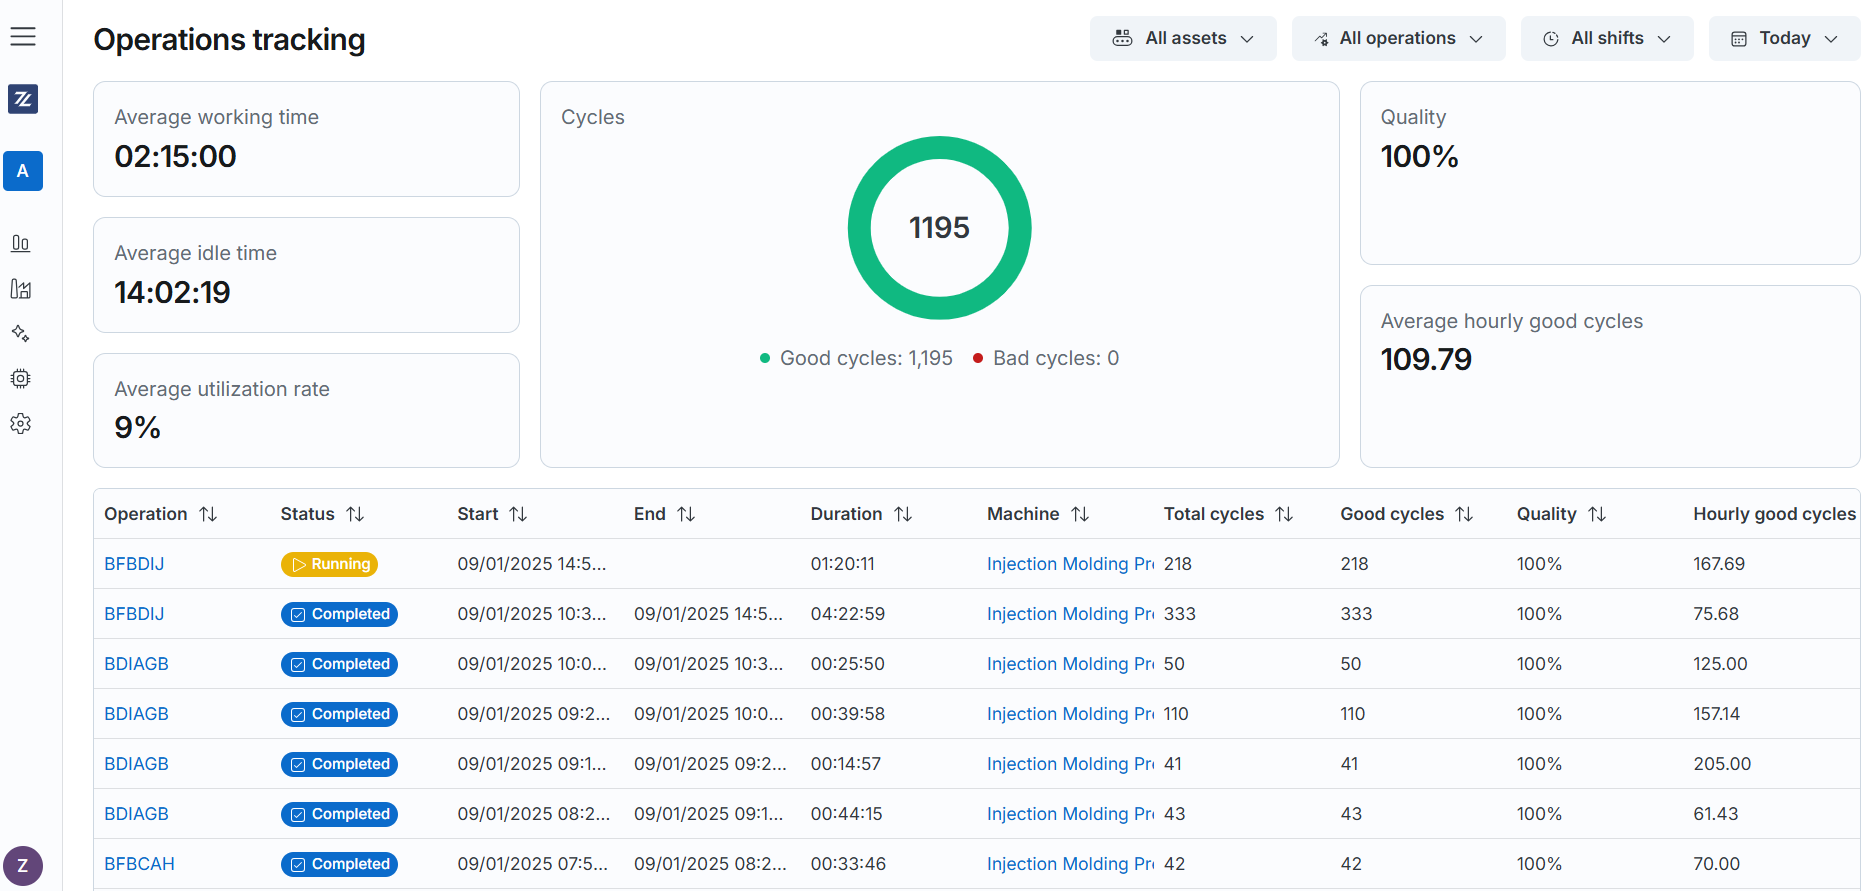
Previously, the platform offered aggregated data on key productivity KPIs for operations. Now, Operations Tracking enables users to access granular details, including the exact start and end times of each operation, its status (completed or ongoing), the machine involved, the operation duration, and key productivity indicators such as the number of defective cycles and the average number of “good” cycles per hour.
This enhanced detail complements the aggregated insights from the Productivity tab, helping users better understand production dynamics and identify inefficiencies. It supports strategic decisions about when and where to execute specific operations to meet productivity and consumption goals.
Key Features
- Dashboard for Operational Efficiency:
- View detailed start, stop, and duration times for each operation as executed.
- Quality KPIs and the number of compliant cycles per hour.
- Session-Level Productivity Monitoring
- Track the average utilization rate of machines during individual production sessions.
- Active Operation Tracking
- Operational status.
- Operation duration.
- Involved machine.
- Total and good cycle counts.
- Production rate.
- Intuitive Interface
- Real-time data visualization.
- Supports quick, strategic decisions.
- Facilitates overall productivity optimization.
The Operations Tracking feature provides a powerful tool for optimizing efficiency within production environments. By offering detailed insights into machine operations, it becomes easier to pinpoint areas of inefficiency or underperformance. This granular visibility allows users to address specific issues, such as unbalanced workloads or operational delays, leading to a more streamlined and productive manufacturing process.
Access to real-time data also empowers users to make faster, more informed strategic decisions. When issues arise—whether related to machine downtime, defective outputs, or process bottlenecks—the availability of up-to-date information enables immediate intervention. This capability minimizes disruptions and ensures smoother production workflows.
Furthermore, the ability to closely monitor and control all aspects of production activities enhances operational oversight. With a clearer understanding of machine performance, managers can make adjustments that directly contribute to profitability. This level of control helps maximize the return on investment in equipment and labor.
Benefits One of the most significant advantages of Operations Tracking is its ability to reduce waste. By identifying defects and inefficiencies as they occur, users can act promptly to address problems before they escalate, resulting in less downtime and fewer resources wasted on faulty production cycles.
The platform also supports a data-driven approach to decision-making. Actionable insights derived from detailed operation data enable businesses to fine-tune their processes and boost overall performance. This approach not only improves operational efficiency but also provides a solid foundation for long-term strategic planning.
Additionally, the comprehensive monitoring capabilities ensure complete visibility into all production activities. Whether it’s identifying idle time, analyzing productive versus non-productive operations, or tracking quality metrics, users can gain a thorough understanding of the factors affecting their production outcomes.