Productivity
Introduction
The Production Insights App allows the user to monitor the productivity of the machines involved in a manufacturing process and to take control of the main parameters and KPIs of a single operation executed on that machine monitor.
This application is divided into two tabs:
- Productivity: Provides data and KPIs allowing users to get information about the efficiency in using production machinery.
- Operation: Provides data and KPIs allowing users to get information about the efficiency in executing a specific operation as per the managed manufacturing process.
A filtering option has also been added for Shifts in Settings. Essentially, it is possible to evaluate the KPIs displayed on the dashboard (availability, performance, consumption, etc.) by considering the data extraction time base set with the calendar (filter set to All shifts), or to see them reparameterized relative to only the hours falling within the shifts set in Settings (in the example, the Central Shift).
Productivity
The productivity tab allows you to get information about the following three KPIs:
- Availability: The ratio between the RUN TIME (i.e., the total hours the machine is in a WORKING state within the selected time interval) and the total hours of availability of the machine itself in that same time interval (i.e., the total hours of the shift that fall within the selected time interval).
NOTE: By not setting any shift filters, it is possible to detect AVAILABILITY values greater than 100% in cases where the machine has worked (in a WORKING state) outside of the scheduled work shifts configured in SETTINGS.
-
Performance: Calculated as the percentage ratio between the ideal cycle time and the measured cycle time of a production machinery over a specified time interval selected.
-
Quality: Calculated as the percentage ratio between the number of cycles/pieces executed on a machinery and the cycles/pieces classified as defective over a specified time interval selected.
The app can calculate the above three main KPIs by aggregating data by factory, fleet, single machinery, and single operations (except for AVAILABILITY, which is not available at the “Operation” aggregation level). In the PRODUCTIVITY section, OEE (Overall Equipment Effectiveness) is also calculated as the product of the three above-mentioned KPIs:
OEE = Quality x Performance x Availability [%]
- Defective cycle/pieces can be measured only if the monitored machinery allows it.
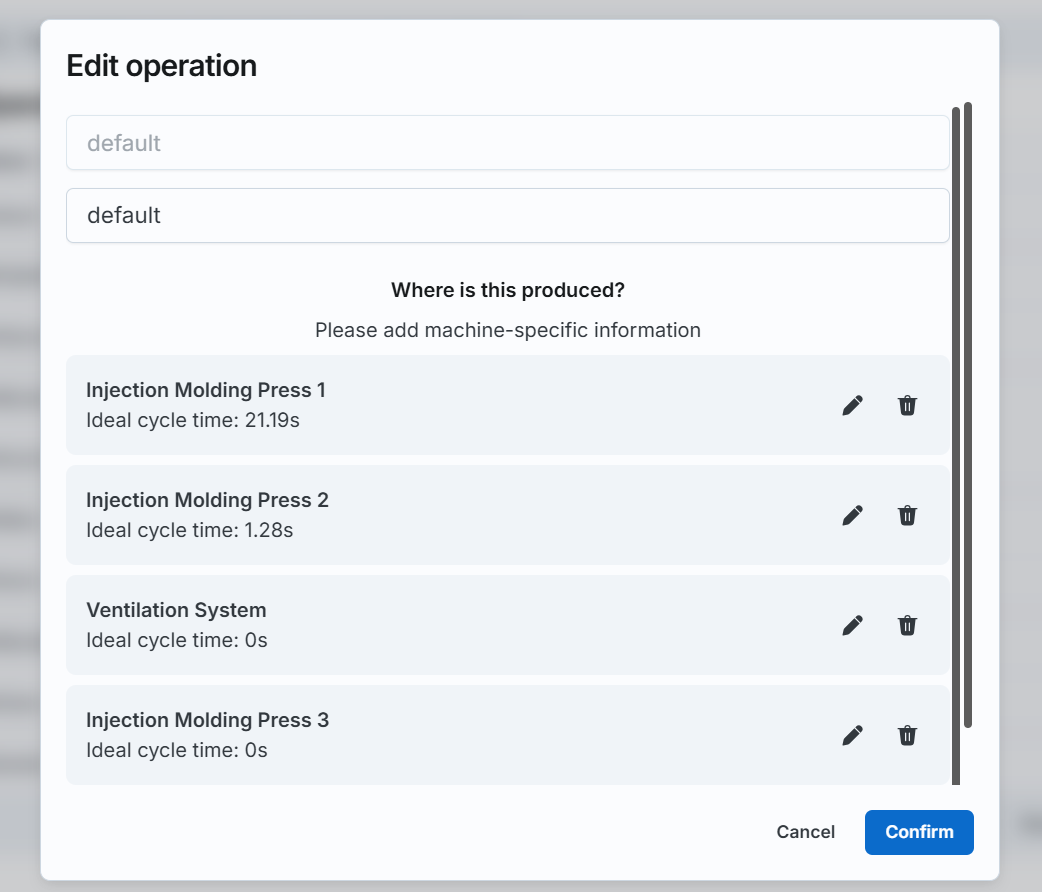
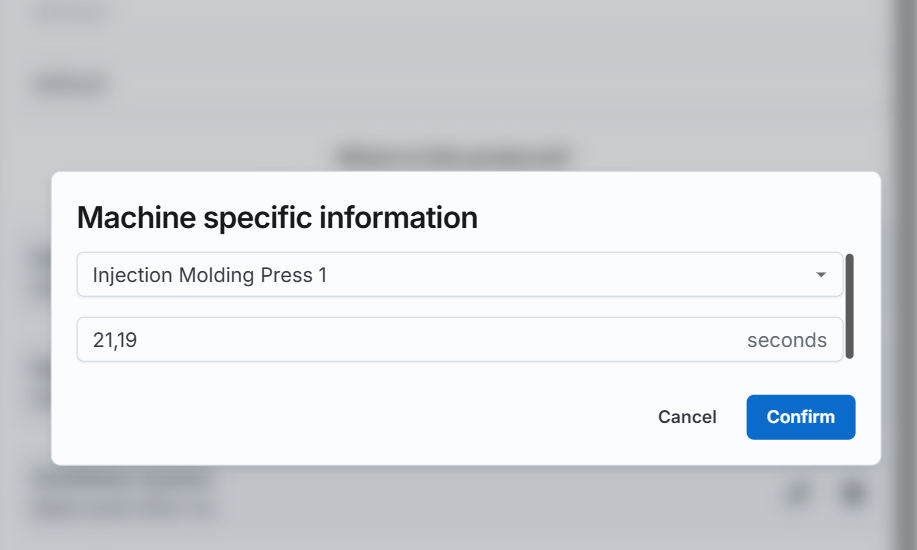
- Ideal cycle time is a value manually set in the SETTINGS menu for a specific machinery.
- Theoretical availability time of a machine is calculated according to the shifts set in the SETTINGS sections.
The productivity page section is divided into two main parts:
- Overview: Provides aggregated info and KPIs at plant/fleet level.
- Machines: A table reporting the main operating info and significant KPIs for each monitored production machine.
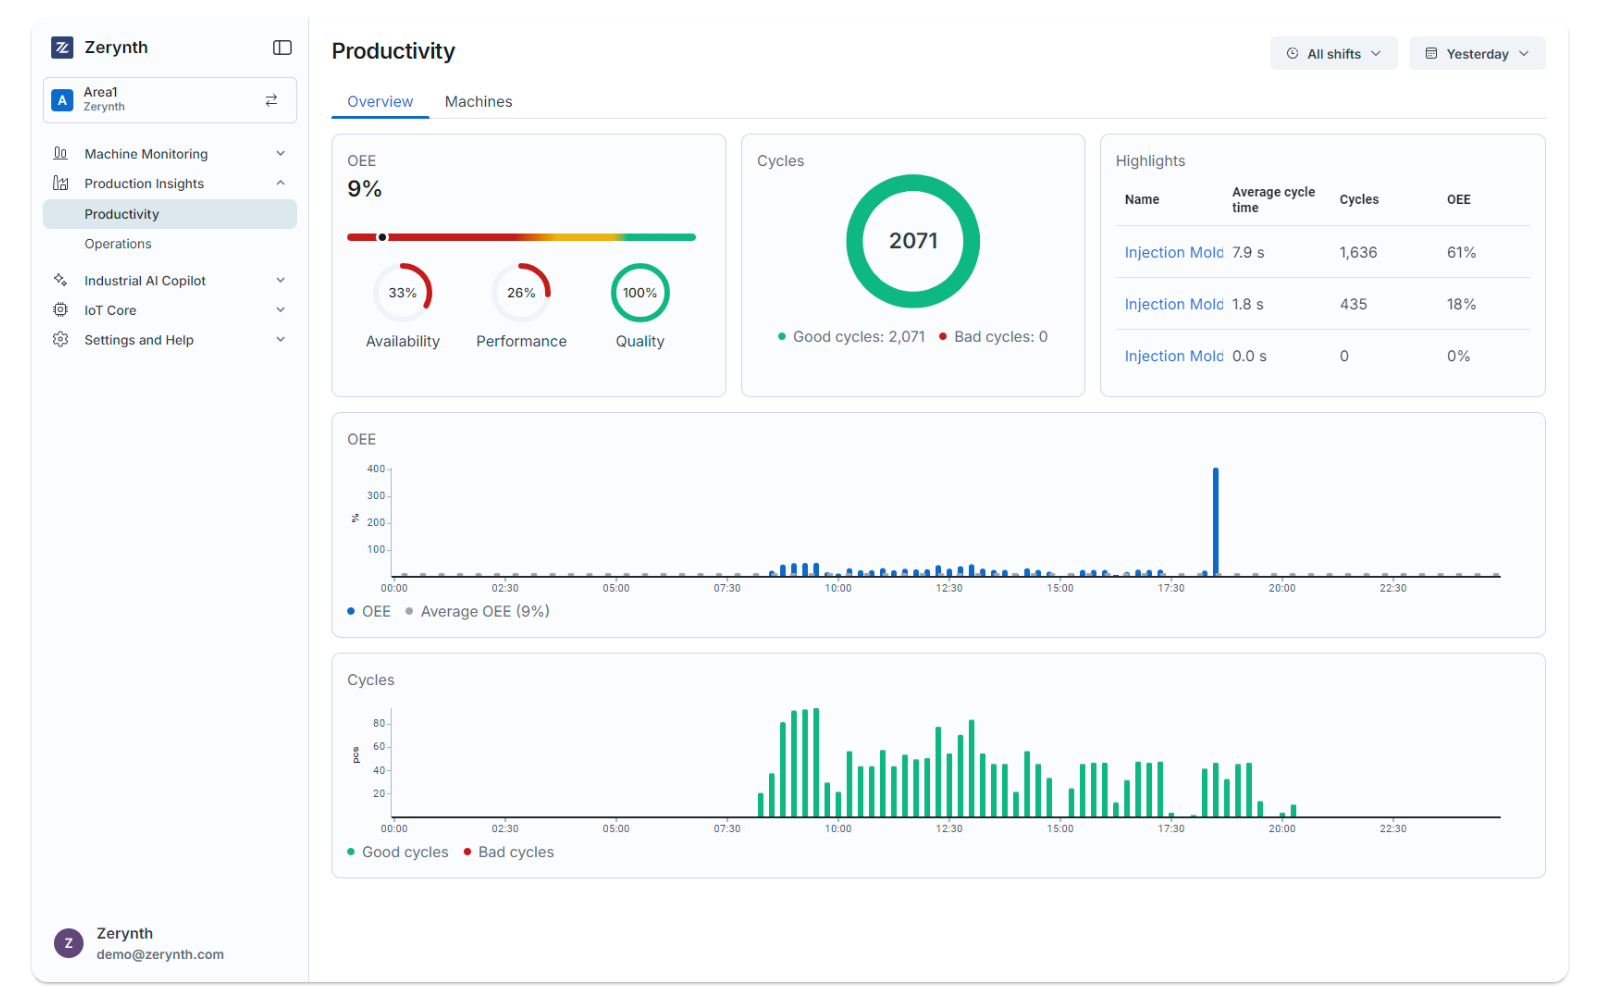
Overview
The first part has three rows of cards.
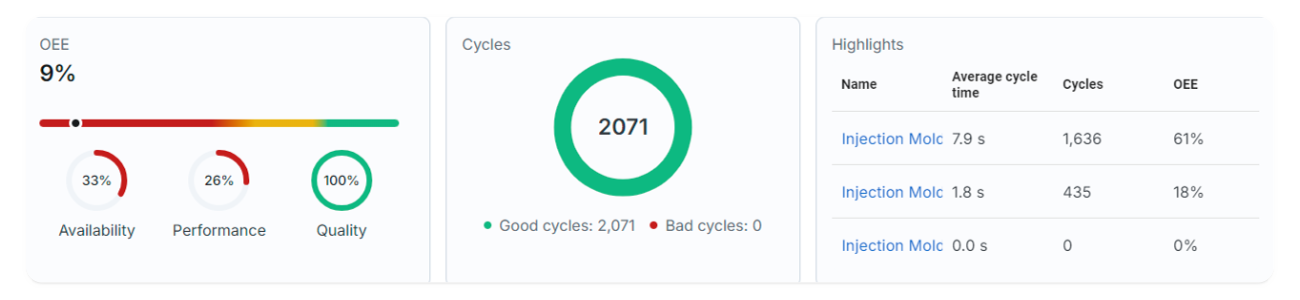
In the first row, the following information is available:
- Average OEE (Overall Equipment Efficiency) of the machines in the workspace.
- Average AVAILABILITY of the machines in the workspace.
- Average PERFORMANCE of the machines in the workspace.
- Average QUALITY of the machines in the workspace.
- NUMBER OF CYCLE (total, good, and bad).
- HIGHLIGHT, which is a table showing for every machine the average cycle time, the number of cycles, and the OEE. By clicking a highlight’s name in the table, you will be redirected to the machine’s detail page, as described below.
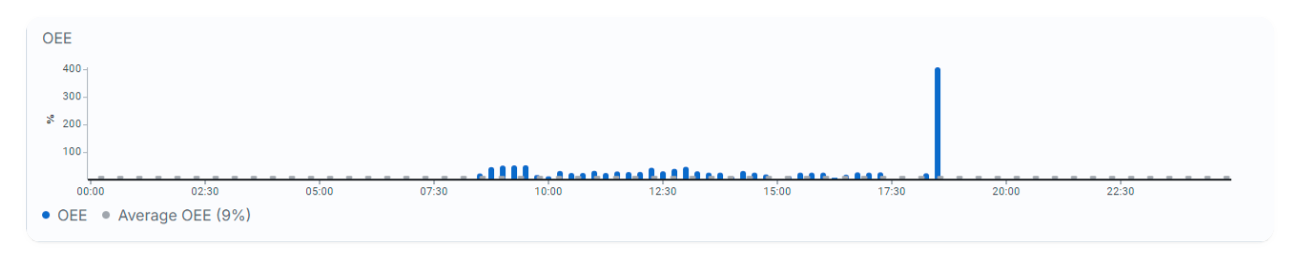
The card in the second row contains the history of the average OEE for the machines in the workspace.
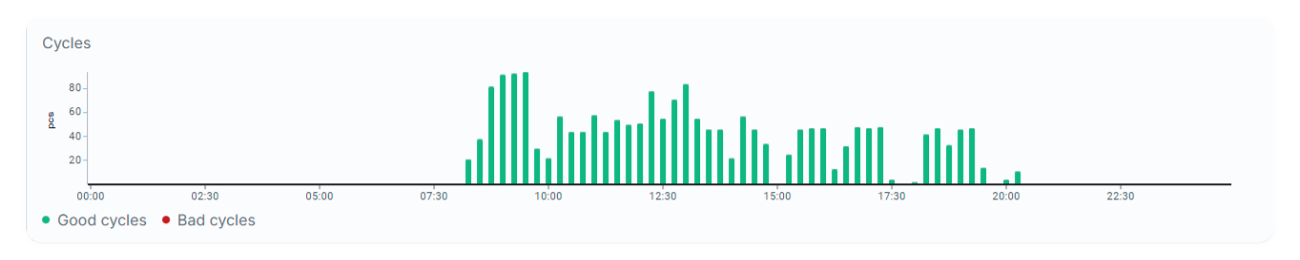
The card in the third row contains the history of the pieces made in total by every machine in the workspace.
Machines
The Machines section contains a table showing a detail of the machines in the workspace.
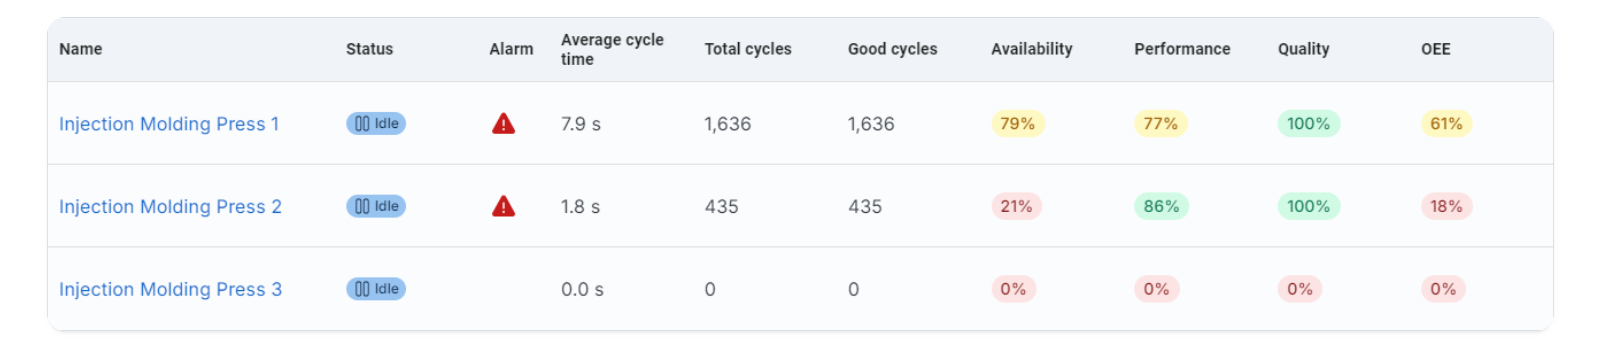
In the table, the following information is available:
- Name of the machine.
- Status of the machine.
- Average cycle time.
- Total cycles.
- Availability of the machine.
- Performance of the machine.
- Quality of the machine.
- OEE of the machine.
Clicking on the name of a machine opens up a more detailed view of the single machine.
Single Machine
The Single Machine view offers a huge amount of information, neatly divided into sections.
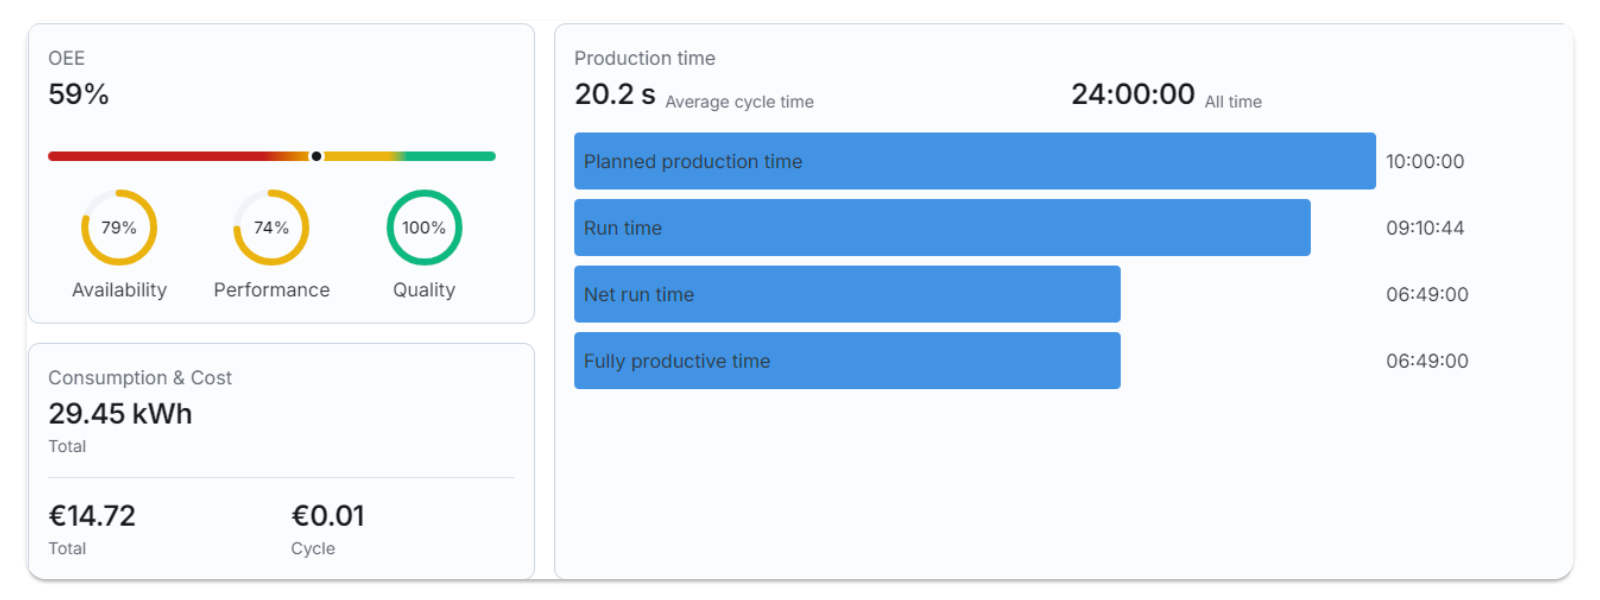
The first row contains:
- OEE: Shows the overall OEE of the machine, with a slider to indicate the current situation. It also shows the single components of the OEE (availability, performance, and quality).
- Consumption & cost: Shows the total consumption of the machine, as well as the total cost of electricity consumed and the cost per single piece.
- Production time: Contains information about the production times of the machine, with details such as the average cycle time, planned production time, run time, net run time, and fully productive time.
- ALL TIME: Represents the selected time interval for data extraction.
- PLANNED PRODUCTION TIME: The time during which the machinery is considered available for operations; for this time, the reference is the configuration of WORK SHIFTS set in the SETTINGS menu.
- RUN TIME: Coincides with the net working time (the total time during which the machinery has been in WORKING mode within the PLANNED PRODUCTION TIME interval). The difference between PLANNED PRODUCTION TIME and RUN TIME corresponds to losses related to the machine's non-utilization despite theoretically being available to the operator.
- NET RUN TIME: The actual working time of the machinery assuming the number of cycles performed in reality but adhering to the ideal cycle time; the difference between RUN TIME and NET RUN TIME corresponds to losses, in terms of time, due to inadequate PERFORMANCE.
- FULLY PRODUCTIVE TIME: Corresponds to the hypothetical working time in the case where in NET RUN TIME all executed cycles are considered valid, without recording any rejects. The difference between NET RUN TIME and FULLY PRODUCTIVE TIME takes into account additional losses on NET RUN TIME due to inadequate QUALITY.
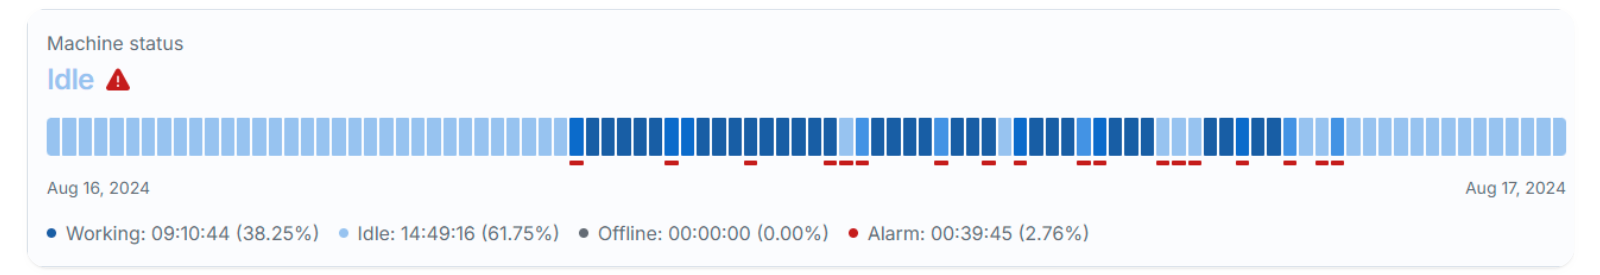
The second row contains the machine status, the history of the machine status (disconnected, idle, working, or alarm), and it provides a time recap of the various states, both in time and percentage over the period selected.
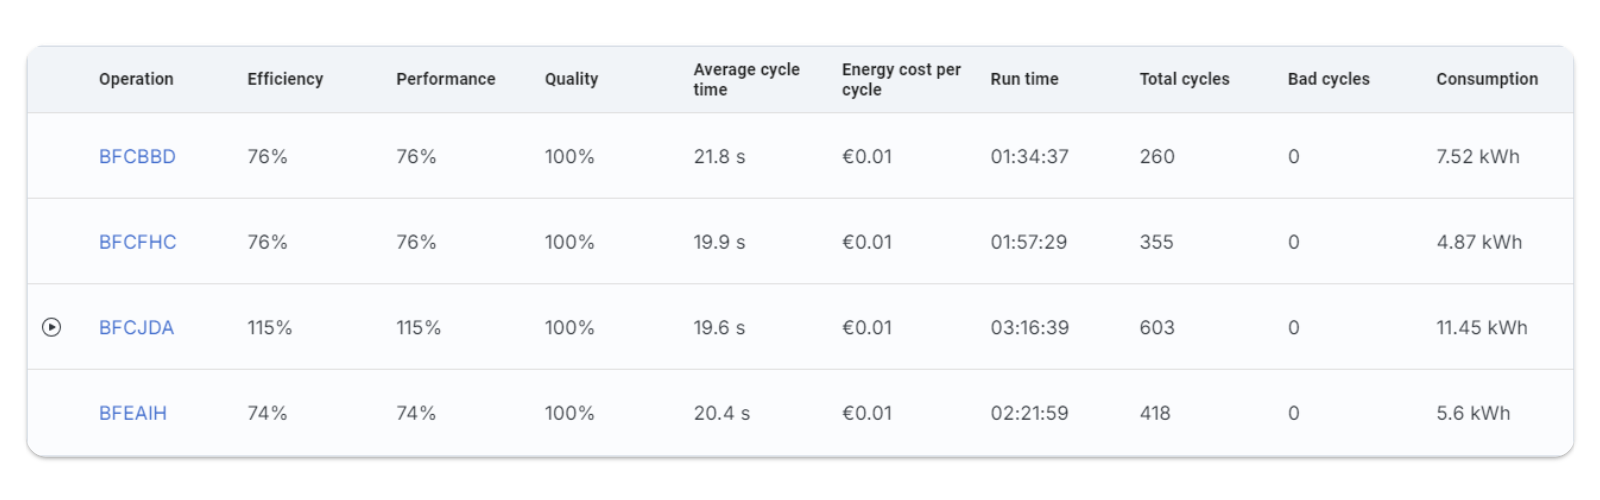
The third row contains the Operation table with the following information for each operation the machine executed during the selected time period:
- Operation.
- Efficiency: The effectiveness of the single operation.
- Performance: The relationship between ACT (Average Cycle Time) and ICT (Ideal Cycle Time).
- Quality: The relationship between Good Cycles and Total Cycles.
- Average Cycle Time: The average amount of time to complete the working cycle.
- Energy cost per cycle: The cost of the energy used in a single cycle.
- Total cycles.
- Good cycles.
- Bad cycles.
By clicking on an Operation’s name, you will be redirected to the single operation in the Operations App.
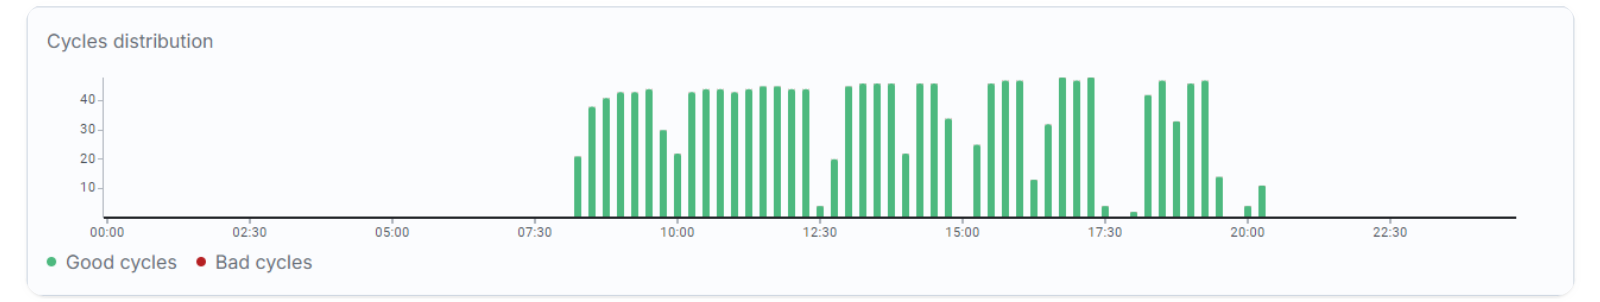
The fourth row contains the cycle/item distribution and shows the pieces (both good and defective) made in every sample by the machine.
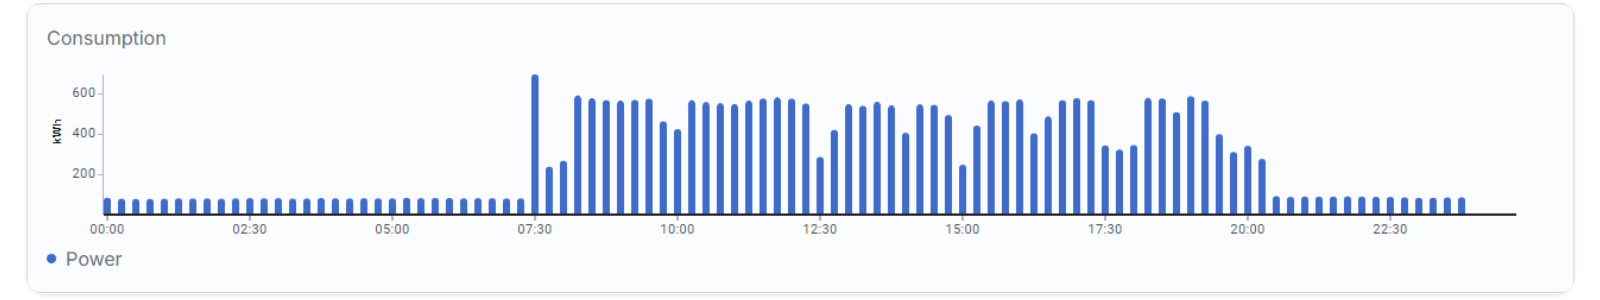
The fifth row contains the Consumption and shows a graph of the electrical consumption (in kWh) of the machine in every sample.
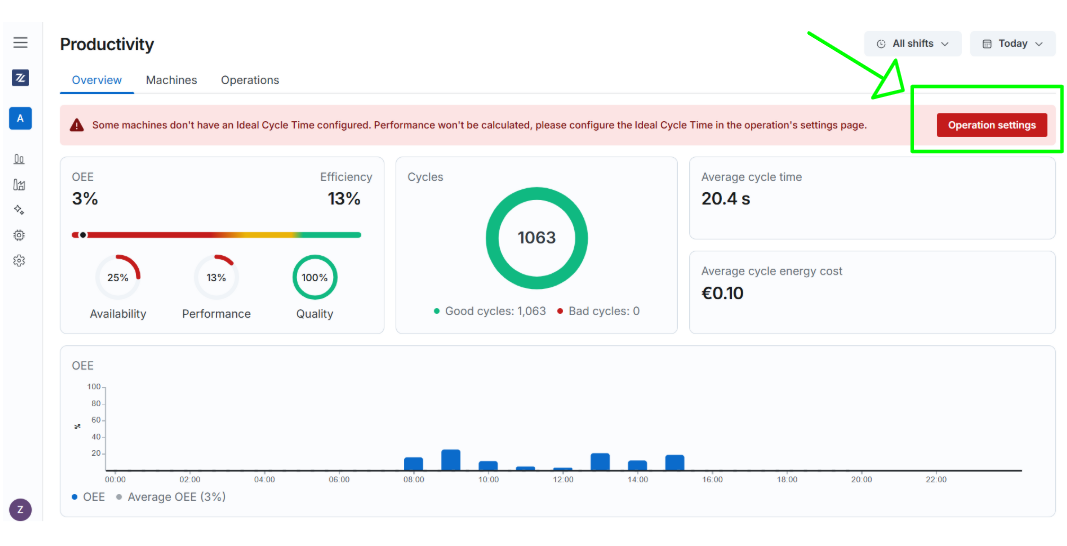
Setting the Ideal Cycle Time
The Ideal Cycle Time feature in Zerynth Production Insights allows users to monitor and optimize production performance based on dynamic references calculated through AI algorithms.
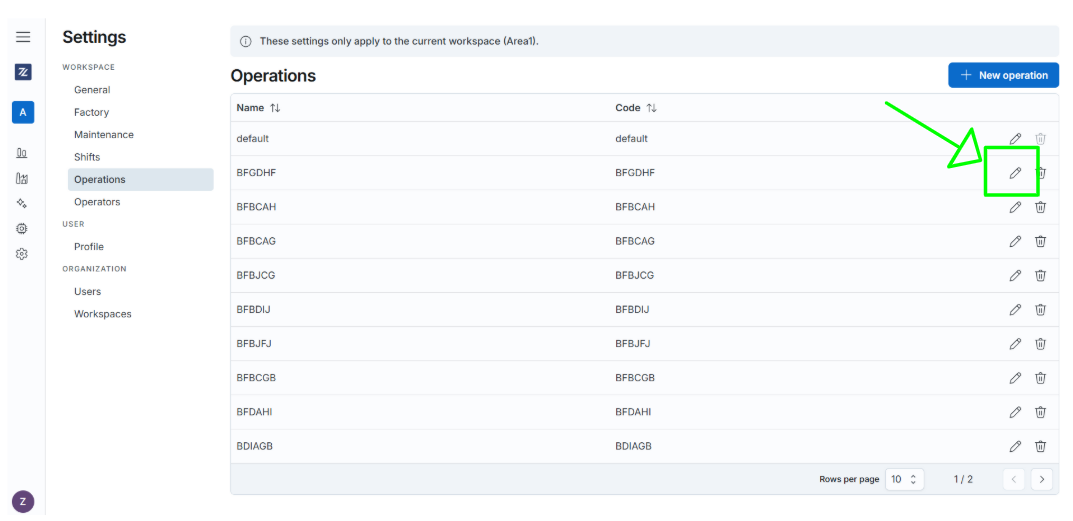
How to Set the Ideal Cycle Time
- Access the Settings: From the platform dashboard, navigate to the Settings section and View Suggested Times
- The AI algorithm analyzes historical machine data to propose an optimized ideal cycle time. These suggestions are automatically displayed in the dedicated tab. If you accept the suggested ideal cycle times, which will be automatically saved as a reference. Customize the times manually to better fit specific operational needs.
- Customize Calculations: Adjust the weighting between ideal cycle time and average cycle time to tailor the calculations further.
- Monitor Performance: once the ideal cycle time is set, go to the Performance section to compare machine KPIs in real time against the ideal times, identifying any deviations and areas for improvement.