Status And Alarms
Overview of machine status and alarms in the Machine Monitoring App.
Overview
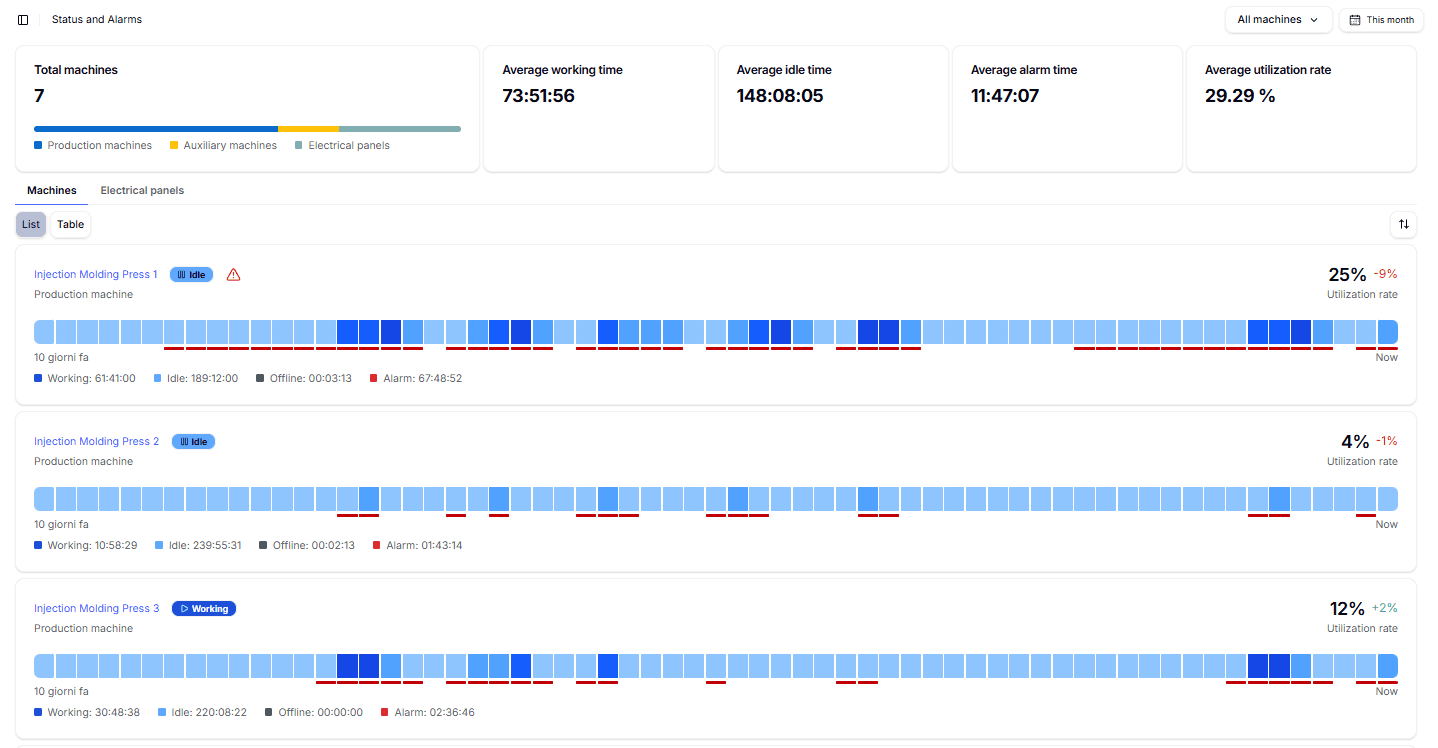
The Status and Alarms section provides a comprehensive overview of the operating status of all machines and electrical panels in a workspace over a selected period. This section helps users identify machine utilization, idle times, and alarms to improve efficiency and minimize downtime.
Categories
- Machines → includes both Production and Auxiliary machines.
- Electrical Panels → dedicated view of electrical panel data.

You can filter the view by machine type using the menu in the top-right corner, selecting Auxiliary Machines or Production Machines, or by navigating to the Electrical Panels tab. Note: In every app, the top-right corner contains a time range selector. You can choose between predefined time ranges or set a custom range. All data is aggregated based on this selection.
Key Indicators in the Header
- Utilization Rate → ratio between actual Working Time and total available time (Working + Idle + Alarm).
- Working Time → total time the machine was in production, detected via status signals or power consumption above a threshold.
- Idle Time → time the machine was powered on but not producing (status ON, no cycles executed).
- Offline Time → time the machine was switched off or disconnected (no signals or consumption).
- Alarm Time → cumulative time with one or more active alarms, based on PLC signals.
List View
Each machine is displayed with:
- Name and type (Production, Auxiliary, Electrical Panel).
- Current status (Operating, Standby, Offline, Alarm).
- State timeline: color-coded blocks showing distribution of states over time.
- Detailed times: hours and minutes spent in each state.
- Utilization rate: percentage of effective usage, with comparison to the previous period.
Table View

The same information is available in a searchable, filterable table with the following fields:
- Machine name
- Machine type
- Current status
- Alarms
- Utilization rate (%)
- Working hours
- Idle/Downtime
- Offline time
- Alarm time
This view enables quick comparison and analysis of machine performance and status.
Electrical Panel KPIs
For each electrical panel, the following KPIs are displayed:
- Working Time → time during which the panel supplies power (based on current signals).
- Disconnected Time → time when no current is detected on all monitored lines.
- Alarm Time → cumulative time with active alarms or anomalies.

